
Wearable Metrics Predict Cognitive Output: What to Measure and Why

Why wearable metrics can predict cognitive output
When you try to improve productivity, you usually start with what you can observe directly: how you feel, how quickly you finish tasks, or how focused you were during a work session. Those cues matter, but they’re also subjective and often arrive after the fact.
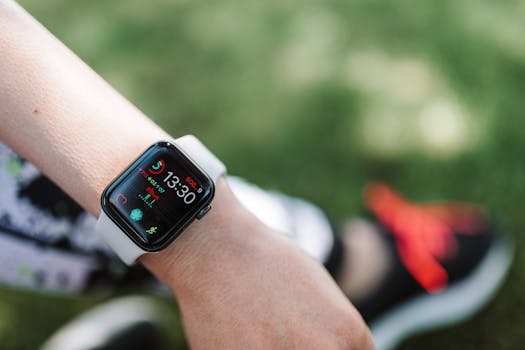
Wearable metrics offer a different angle. They capture physiological signals continuously—sleep patterns, resting heart rate trends, heart-rate variability, movement intensity, skin temperature, and sometimes even blood oxygen saturation. Over time, these indicators can correlate with how much cognitive work you can reliably produce: sustained attention, learning speed, error rates, and decision quality.
The key idea behind wearable metrics predict cognitive output is not that a watch can “read your mind.” It’s that your body’s state influences your brain’s available resources. When you measure the body well, and you evaluate outcomes consistently, you can build an evidence-based model of your own performance.
In this guide, you’ll learn what to track, how to interpret signals without overclaiming, and how to design a simple measurement workflow you can actually use. You’ll also see a practical scenario that shows how these metrics can shape a day’s plan.
What “cognitive output” means in measurable terms
Before you connect wearables to performance, you need a clear definition of cognitive output. In productivity systems, “output” is rarely just speed. It’s speed with reliability.
For practical tracking, cognitive output usually includes one or more of the following:
- Throughput: amount of work completed in a set time window (e.g., pages edited per hour, tickets resolved per sprint day).
- Accuracy: error rates, rework frequency, or defect counts.
- Sustained attention: performance consistency across a session (e.g., fewer attention lapses after 45 minutes).
- Learning efficiency: how quickly you retain information or solve similar problems (e.g., quiz scores after 24 hours).
- Decision quality: outcomes like fewer revisions, lower rollback rates, or reduced time spent recovering from mistakes.
To link wearables to performance, you’ll need a repeatable measurement method. Pick one primary outcome and one supporting outcome. For example: “coding output” could be measured as accepted pull requests per 4-hour block (primary) and defect-free rate (supporting). If you’re studying, it might be practice-test score improvement (primary) and time-to-comprehension (supporting).
Most people make the mistake of measuring “productivity” as a vague feeling. Wearable-based prediction requires at least one metric that you can record daily or per session.
The physiological signals that matter most
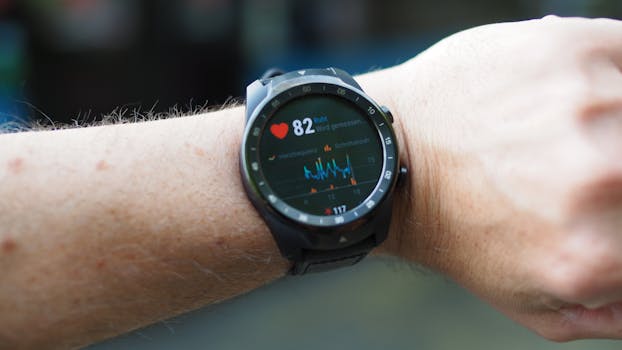
Wearables differ in sensors and algorithms, but many provide overlapping signals. The most useful signals for predicting cognitive output tend to fall into three categories: recovery, stress physiology, and energy availability.
Sleep duration, timing, and regularity
Sleep is the foundation. Even if you wear your device for months, sleep remains the strongest predictor for next-day cognitive performance for many people.
Look at:
- Total sleep time: how many hours you slept.
- Sleep regularity: how consistent your bedtime and wake time are.
- Sleep stages (if available): proportion of deep and REM sleep.
- Waking frequency: number of interruptions can correlate with reduced attention.
A practical interpretation: if your sleep window shifts by more than 1 hour from your usual schedule, your next-day performance may dip even when total sleep time looks “good.” Regularity often matters as much as duration.
Resting heart rate trends
Resting heart rate (RHR) is a common wearable metric. When RHR rises relative to your baseline, it can indicate incomplete recovery, stress, or early illness. Those factors can reduce cognitive efficiency.
Rather than treating a single day’s RHR as a verdict, track trends. A common approach is to compare today’s RHR to your 14-day average. If you see a sustained increase of about 3–5 beats per minute for several days, you may notice lower output, slower learning, or more error-prone work.
Important: RHR is influenced by exercise, hydration, alcohol, caffeine timing, and ambient temperature. Prediction works best when you account for major confounders.
Heart-rate variability (HRV) and stress physiology
Heart-rate variability (HRV) reflects how your autonomic nervous system adapts. Higher HRV (relative to your baseline) often corresponds to better recovery and readiness. Lower HRV can be associated with stress, fatigue, or insufficient sleep.
When you use HRV for cognitive prediction, the timing matters. Many wearables report HRV in the morning. Morning HRV can be especially useful because it’s closer to your baseline state before your day’s demands.
Try this: for each day, record morning HRV (or your device’s readiness score) and compare it to your cognitive output measured later. Over 2–3 weeks, you’ll likely see patterns such as “low HRV days correlate with more mistakes” or “high HRV days correlate with faster task completion.”
Be cautious about absolute thresholds. HRV is highly individual. Prediction is about your personal baseline, not a universal number.
Movement and activity load
Activity metrics can predict cognitive output in both directions. Moderate movement can improve alertness and mood. Too much intensity—especially late in the day—can impair sleep quality and next-day focus.
Useful activity signals include:
- Total steps or active minutes
- Training load (if your wearable provides it)
- Intensity distribution (time spent in higher heart-rate zones)
A practical interpretation: if you have a hard workout within 3–4 hours of bedtime, you may see reduced sleep depth or increased nighttime awakenings. That can then show up in next-day cognitive output.
Skin temperature, blood oxygen saturation, and recovery
Some wearables report skin temperature trends and blood oxygen saturation (SpO2). These can be relevant for recovery and sleep quality. For example, lower overnight oxygen saturation can correlate with disturbed sleep and next-day fatigue.
However, these signals are more sensitive to sensor fit and measurement conditions. If you use them, treat them as supportive data. Don’t build your model solely on them unless your data quality is consistently high.
How prediction actually works: correlation, lag, and individual baselines
Prediction is a process, not a single magic feature. To make wearable metrics useful, you need to understand three concepts: correlation vs. causation, time lag, and personalization.
Correlation is a starting point
If your HRV is low on days when you make more mistakes, that’s a meaningful correlation. But it doesn’t automatically mean HRV “caused” the mistakes. The underlying driver might be stress, poor sleep, illness, or workload.
In practice, correlation still helps you. You’re not trying to prove biology—you’re trying to anticipate performance risk and adjust your plan.
Time lag between metrics and outcomes
Not all metrics predict the same time horizon.
- Sleep metrics often influence next-day output (0–1 day lag).
- RHR and HRV can reflect recovery over several days (1–3 day lag) depending on training and stress.
- Acute stress signals (like elevated heart rate during the day) may predict performance within the same day, especially for tasks requiring sustained attention.
When you analyze your data, consider lag windows rather than assuming every metric maps to the same day’s output.
Your baseline is the model
Wearable algorithms produce values that are meaningful primarily relative to you. Two people can have the same HRV number but very different interpretations. That’s why the most practical approach is to build a personal baseline using your own last 14 to 30 days of data.
Once you have baseline ranges, you can interpret deviations: “My HRV is 20% below my 30-day average” or “My RHR is 4 bpm above normal.” Those relative changes tend to be more stable than raw values.
Design a simple tracking system that links wearables to outcomes
If you want wearable metrics predict cognitive output to be more than a theory, you need a workflow. The best systems are lightweight enough to maintain for months.
Step 1: Choose one cognitive output metric for 14 days
Pick one primary metric you can record consistently. Examples:
- Number of deep-work hours completed (defined as uninterrupted focus blocks).
- Number of high-quality deliverables (e.g., accepted edits, solved problems, reviewed documents without rework).
- Accuracy score on a daily practice test.
Make the measurement time-bounded. For instance, measure output per 4-hour work block, or per day’s work period. This reduces noise.
Step 2: Record wearable metrics at consistent times
Use the same timing each day. A common setup:
- Morning: HRV, resting heart rate, readiness score, sleep duration.
- Evening: total steps, training load, sleep onset time, total sleep time (once you get the data).
Consistency matters more than volume. If you collect morning metrics at varying times, your comparison becomes less reliable.
Step 3: Add a small context log (workload and stress)
Wearables can’t capture everything. You’ll improve prediction by adding two or three context variables you can record in under 30 seconds:
- Workload: “low / medium / high” or a simple 0–10 rating.
- Caffeine timing: whether you had caffeine after noon.
- Illness or soreness: a yes/no flag.
This is where many people see immediate gains. If low HRV days also coincide with high workload days, you can separate general stress from recovery-related patterns.
Step 4: Use a lag-aware analysis approach
You don’t need advanced statistics to start. A practical method is to categorize outcomes:
- Mark your output each day as High, Medium, or Low relative to your own 14-day range.
- For each category, look at average sleep duration, average morning HRV, and average RHR deviation from baseline.
After 2–3 weeks, you’ll likely identify a pattern like: “My high output days happen when morning HRV is above my 14-day median and sleep duration is at least 7 hours.”
If you want to go deeper, you can analyze with simple spreadsheets and compute correlations for different lags (same day vs. next day). The point is to learn your personal mapping between physiology and performance.
Interpreting metrics without falling into common traps
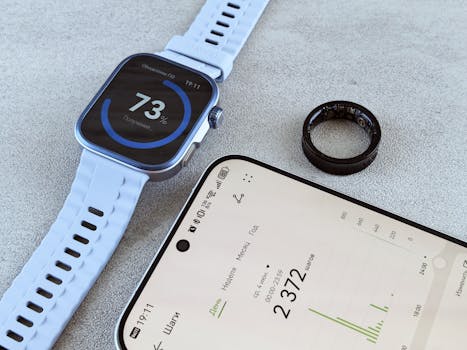
Wearable data is useful, but it’s also easy to misread. Here are the most common failure modes and how you can correct them.
Trap: treating a single day as predictive
One abnormal day is often an outlier: travel, a late meal, a stressful meeting, or sensor misfit. Prediction improves when you look at 7-day and 14-day windows.
Guideline: if you only have one data point, you don’t have evidence. Wait for a pattern.
Trap: ignoring sensor fit and measurement quality
Many wearable metrics are sensitive to how the device sits on your body. Loose straps can reduce accuracy for heart rate and HRV. Night measurements can be affected by movement or skin temperature changes.
Practical fix: check fit weekly and whenever readings look implausible (for example, HRV spikes dramatically after a day of unusually low movement).
Trap: using readiness scores as truth
Readiness scores are convenient, but they’re proprietary and may combine multiple signals. They can be helpful as a single indicator, but if you want to understand why your output changes, you should also review the underlying metrics (sleep duration, RHR, HRV trends).
Trap: assuming causation from an observed pattern
Even if you see that low HRV days correspond to reduced output, the cause might be workload, poor sleep quality, or impending illness. The actionable part is still valuable: you can adjust your day based on risk signals.
Think in terms of risk management, not “my watch predicted my mind.”
Trap: ignoring behavioral confounders
Caffeine, alcohol, late meals, hydration, and exercise timing all influence both wearables and cognition. If you don’t log them, you may attribute performance changes to physiology when the real driver is behavior.
Even a simple caffeine-after-noon flag can explain a surprisingly large fraction of variance.
Practical scenarios: using wearable signals to plan your day
Let’s make this concrete with a scenario you can adapt.
Scenario: the “deep work” day that almost didn’t happen
Imagine you have a 90-minute block scheduled for complex writing and analysis. You check your wearable data in the morning and notice:
- Sleep duration: 6.2 hours (your typical is ~7.4 hours)
- Morning HRV: 18% below your 30-day median
- Resting heart rate: 4 bpm above your 14-day average
Instead of canceling your plans, you treat this as a forecast of reduced cognitive efficiency. You adjust the plan:
- You move the hardest analysis to the second half of the day, after a short warm-up session.
- You reduce the scope of the writing task from “final draft” to “outline + key arguments.”
- You schedule a 10-minute walk mid-block to reduce mental fatigue.
By evening, you compare output to your usual standard. You may still produce less than on your best days, but your error rate stays lower because you avoided over-demanding your attention early.
Two weeks later, you might discover a consistent rule: on days with HRV more than ~10–20% below baseline and sleep under 6.5 hours, you perform better when you shift high-cognitive tasks later and tighten your scope.
This is what “wearable metrics predict cognitive output” looks like in practice: you don’t need certainty; you need probability and a plan.
How to turn predictions into a productivity system
Prediction becomes useful when it changes how you schedule work. The goal is not to optimize everything. It’s to allocate your best cognitive effort to the tasks that require it most.
Create a daily decision framework
Use a simple three-tier approach based on your metrics and your personal baseline:
- Ready day: morning HRV at or above your median and sleep duration within your normal range.
- Mixed day: one metric slightly off (e.g., sleep short by 30–60 minutes or HRV moderately reduced).
- Risk day: multiple recovery indicators off (e.g., HRV significantly below baseline and RHR elevated).
Then pre-assign work types:
- Ready: deep work, complex problem solving, high-stakes writing.
- Mixed: planning, editing, structured tasks, moderate cognition work.
- Risk: low-ambiguity tasks, triage, admin, review, and “stop-loss” planning for deep work.
This keeps you from relying on willpower. Your schedule adapts to your physiology.
Use session design to protect attention
Even with good metrics, cognitive output depends on session structure. When you’re on a risk day, adjust the session design:
- Shorter blocks: switch from 90-minute blocks to 25–45 minute blocks.
- Earlier breaks: if your wearable shows stress signals, add a break at 30–40 minutes.
- Lower cognitive load: choose tasks that don’t require constant context switching.
Wearables can flag when your brain is likely to fatigue faster. Your job is to reduce the demand.
Plan learning and skill practice around recovery
Learning is particularly sensitive to sleep and stress. If you study or train skills, use wearables to schedule practice:
- On high-recovery days, do new material and complex problem sets.
- On risk days, do spaced review, flashcards, or worked examples.
Over time, your results improve because you’re matching cognitive challenge to biological readiness.
What to do when wearable predictions conflict with your feelings
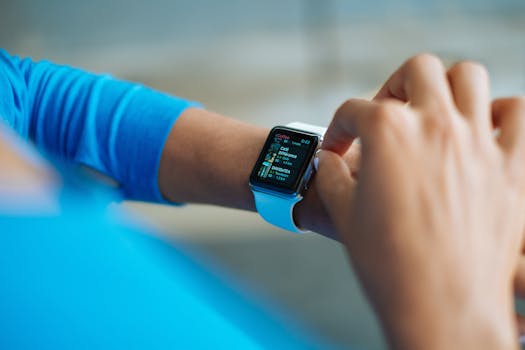
This happens often. You might feel “fine” but have low HRV and short sleep. Or you might feel foggy but your metrics look good. Which should you trust?
Use a combined approach:
- If metrics indicate risk, start with a smaller scope and see how your performance evolves within the first 15–20 minutes.
- If metrics look ready but you feel off, check external factors: hydration, caffeine timing, recent conflict, or a looming deadline stressor that isn’t captured by physiology yet.
Feelings are data too. The difference is that wearables give you a consistent signal that often arrives before you fully notice the impact.
Relevant wearable data sources you may encounter
Many people use consumer wearables such as smartwatches and fitness bands. Commonly available metrics include sleep duration, HRV, resting heart rate, steps, and sometimes training load estimates. Some platforms provide “readiness” scores that combine metrics into a single indicator.
In a productivity context, you don’t need to chase every feature. You need stable metrics and consistent collection. If your device produces HRV and morning resting heart rate reliably, you already have a strong starting point.
If you’re using a platform that stores data in a dashboard, you can often export sleep summaries and heart metrics. That can help you build your personal baseline and track changes over months.
How long you need to collect data to see real patterns
It’s tempting to expect immediate predictive value. In reality, you need enough data to separate routine from noise.
Here are reasonable timelines:
- 7 days: you may notice obvious outliers, but patterns can still be unstable.
- 14 days: enough to begin seeing baseline differences, especially for sleep-related effects.
- 30 days: generally sufficient for more reliable personal thresholds (e.g., HRV below your median correlates with lower accuracy).
For best results, run your system for at least a month. Then refine your rules based on what actually improved your outcomes.
Limitations and safety: what wearables can’t guarantee
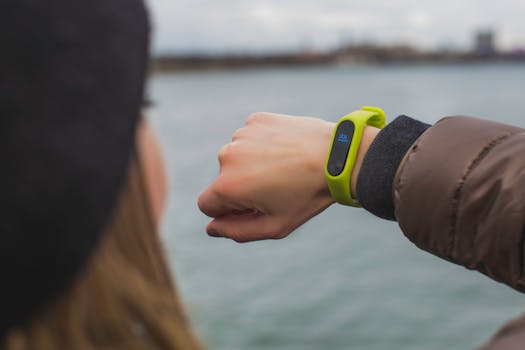
Wearables are not medical devices in the way clinical monitoring is. Their metrics can be influenced by motion artifacts, sensor placement, algorithm updates, and individual physiology. Also, cognitive output can be affected by factors wearables don’t measure directly: motivation, task design, social context, and environmental noise.
Use wearable metrics as a productivity signal, not as a health diagnosis tool. If you see persistent abnormal readings (for example, consistently very low oxygen saturation or sustained resting heart rate elevations), consider consulting a qualified healthcare professional.
For productivity decisions, treat predictions as probabilistic guidance. You’re reducing risk, not making absolute claims.
Summary: a prevention-first approach to cognitive performance
If you want wearable metrics predict cognitive output to work for you, focus on prevention and consistency:
- Define cognitive output with at least one measurable daily or per-block metric.
- Track wearables consistently at the same times, using personal baselines.
- Account for lag (sleep affects next-day performance; recovery can affect multiple days).
- Use context logs for workload and caffeine timing to reduce confounding.
- Adjust your schedule based on risk tiers rather than relying on willpower.
Over time, your wearable data becomes a practical early-warning system. Instead of discovering fatigue after your work block collapses, you can plan around it—protecting accuracy, preserving attention, and keeping your output steady even when your body isn’t at peak readiness.
FAQ: wearable metrics and predicting cognitive performance
Can wearables really predict how well I’ll think tomorrow?
They can often predict risk for reduced cognitive performance, especially when sleep and recovery signals are involved. The prediction is usually personal and probabilistic, not deterministic. With 2–4 weeks of consistent measurement, many people can identify patterns that help them plan.
Which metrics are the most useful for cognitive output?
For many users, sleep duration/regularity, morning resting heart rate trends, and HRV (relative to your baseline) are the most informative. Movement and training load can also matter, particularly when they affect sleep quality or recovery over the next 1–3 days.
How many days of data do I need before I can trust the pattern?
Expect early signals around 7–14 days, but aim for at least 30 days for more stable personal thresholds. If your workload is highly variable, longer collection may be needed.
What if my wearable readings and my feelings don’t match?
Use both. If metrics suggest risk, start with a smaller scope for the first 15–20 minutes and adjust based on actual performance. If you feel off but metrics look ready, check external drivers such as hydration, caffeine timing, and recent stressors not captured by wearables.
Do I need advanced analytics to use wearable prediction?
No. You can start with simple categorization (high/medium/low output) and compare averages of sleep, HRV, and RHR. If you want more precision, you can compute correlations or test lags in a spreadsheet.
Are wearable metrics safe to use for productivity decisions?
In general, yes for planning tasks and managing workload. But wearables are not medical diagnostic tools. If you notice persistent abnormal health-related readings or symptoms, seek professional medical guidance.
10.03.2026. 05:25