Wearable Metabolism Metrics: How to Interpret Your Data
Why wearable metabolism numbers can feel confusing
Wearable devices increasingly report “metabolism” related metrics such as resting metabolic rate (RMR), estimated calories, and sometimes activity-based energy expenditure. The goal is useful: translate signals from sensors like heart rate, movement, and temperature into estimates of how much energy your body uses. The challenge is that these outputs are not direct measurements. They are modeled estimates built from algorithms and assumptions, and those assumptions can vary by device.
To interpret wearable metabolism metrics well, you need to understand what the device is likely measuring, what it is estimating, and how lifestyle factors influence the inputs. This guide explains the most common metabolism-related outputs, how to read trends without overreacting to day-to-day noise, and how to sanity-check results using practical methods.
What wearables mean by “metabolism”
In everyday language, metabolism refers to the body’s energy use. In wearable reporting, “metabolism metrics” usually combine two ideas:
- Resting energy use (often called resting metabolic rate, RMR): energy your body spends while not actively moving.
- Total energy expenditure (sometimes called TDEE): resting energy plus energy from activity, exercise, and other day-to-day movement.
Most consumer wearables do not measure oxygen consumption directly (which is how clinical systems estimate metabolic rate). Instead, they infer energy needs from proxies such as:
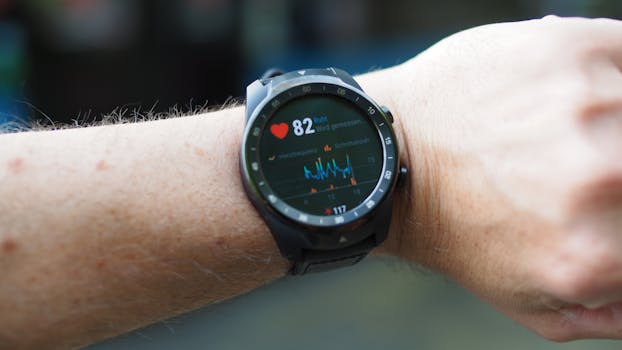
- Heart rate (linked to energy demand)
- Movement data (step counts, accelerometer patterns, activity intensity)
- Personal inputs you enter (age, sex, height, weight)
- Skin temperature and sometimes blood oxygen (in some models), which may influence thermoregulation estimates
Because these are indirect signals, your device’s “metabolism” outputs are best treated as trend indicators and relative comparisons rather than exact lab-grade values.
Key metabolism metrics you may see on a wearable
Different brands label metrics differently, but several categories appear frequently. Understanding what each one represents makes the data much easier to interpret.
Resting metabolic rate (RMR) or resting energy
RMR is the energy your body uses at rest. Wearables often display an estimated RMR based on heart rate patterns, movement baseline, and your entered profile. Some devices may adjust RMR estimates during the day using changes in heart rate and other signals.
How to interpret it: Look for consistent patterns over time. If your RMR estimate rises after illness, poor sleep, or high stress, that doesn’t automatically mean “fat loss is faster.” It may reflect temporary physiological changes that increase heart rate or thermoregulation.
Calorie burn estimates (active calories, total calories, TDEE)
Many wearables show “calories burned,” typically separated into resting/total and activity/active components. These numbers are derived from predictive models rather than direct measurement.
How to interpret it: Use these to estimate whether your days are consistently more or less active, not to judge a single day’s accuracy. If your step count, workout frequency, or overall movement changes, the total will usually follow.
Metabolic rate trends and “energy balance” style metrics
Some platforms show a “metabolic rate” graph, energy expenditure curve, or even a derived “energy balance” concept. These are typically algorithmic outputs that combine RMR estimates with activity and sometimes sleep or recovery indicators.
How to interpret it: Treat derived graphs as a summary of your inputs. If the platform says your metabolism is “higher,” it may be reflecting higher heart rate baseline, more activity, or both.
Sleep-related energy estimates
Some wearables allocate energy expenditure during sleep using heart rate variability, resting heart rate, and movement suppression. Sleep stages, however, are not measured with the same precision as clinical polysomnography.
How to interpret it: If sleep is consistently shorter or fragmented, resting heart rate may increase and the device may infer slightly higher energy use. This is a plausible physiological effect, but it still remains an estimate.
How wearables estimate metabolism from sensor data
To interpret results responsibly, it helps to know the typical modeling logic behind these metrics.
Heart rate as a proxy for energy demand
Heart rate correlates with oxygen demand and energy use, but it is not perfectly specific. Hydration status, caffeine, stress, temperature, and illness can raise heart rate without a proportional change in energy expenditure. As a result, wearable metabolism estimates can drift during periods of stress or sickness.
Practical interpretation: If your RMR estimate rises while your activity remains low, check for confounders like poor sleep, high stress, dehydration, or caffeine intake.
Movement data and activity intensity
Accelerometers estimate how much you move and how intensely you move. The device then applies energy cost assumptions to those patterns. This is usually more reliable for walking and running than for activities with complex biomechanics (cycling, rowing, strength training) unless the device has robust activity recognition.
Practical interpretation: If you do strength training or cycling, ensure the wearable recognizes those activities accurately. Otherwise, metabolism-related outputs may under- or over-estimate energy use.
Personal profile inputs and algorithm assumptions
Height, weight, age, and sex strongly influence baseline energy estimates. Even small inaccuracies in body weight can shift calorie estimates noticeably. If you entered your weight long ago and it has changed, your metabolism numbers may appear “off” even if the device is working as intended.
Practical interpretation: Update profile details when weight changes significantly, and interpret the resulting metrics as recalibrated estimates rather than a sudden biological change.
Temperature, skin readings, and thermoregulation effects
Some wearables use skin temperature or related signals to infer thermoregulation and adjust energy estimates. Cold environments can change peripheral blood flow and heart rate even if movement is unchanged.
Practical interpretation: Environmental conditions can influence the “metabolism” curve. If you travel or change climate, expect the data to shift.
Interpreting trends vs. single-day values
The biggest mistake people make with wearable metabolism metrics is treating daily numbers like precise measurements. Algorithms can vary with sensor quality, daily physiology, and how you used the device.
What “normal noise” looks like
- Heart rate variability changes from day to day due to stress, sleep quality, and hydration.
- Sensor placement can affect readings, especially for wrist devices.
- Activity recognition may miss certain exercise types.
- Resting baseline can drift after long days, late meals, or illness.
So, a one-day spike or dip in metabolism-related metrics usually has more to do with inputs and estimation models than with a true metabolic shift.
How to evaluate meaningful changes
Instead of focusing on a single day, use a time window and consistent conditions. A common approach is to compare:
- 7-day averages for RMR/resting energy estimates
- 2–4 week trends for patterns like “my resting energy is rising” or “my calorie burn is consistently lower”
- Same routine comparisons (similar sleep timing, similar workdays, similar diet timing)
If the trend persists across multiple weeks, it’s more likely to reflect real lifestyle changes.
Common reasons metabolism estimates look “wrong”

Wearables can be accurate within their modeling framework, yet still produce outputs that seem contradictory to your experience. Here are frequent causes of confusion.
Weight and body composition changes
Even if your weight is stable, body composition can change. However, most consumer wearables do not directly measure body fat or lean mass. They rely on your input weight and generalized relationships between body size and energy needs.
Interpretation tip: If you’ve gained muscle or lost fat, the device may not fully capture changes in metabolic rate. Use trends and consider that the estimate may lag behind reality.
Diet timing and thermic effect of food
Eating affects energy use through digestion and nutrient processing. Some wearables may partially reflect these changes via heart rate and activity patterns, but they typically do not measure digestion directly.
Interpretation tip: If your metabolism-related curve spikes after meals, it may be partly digestion-related, but it can also be heart rate and activity changes. Don’t assume the device is “seeing” thermic effect precisely.
Illness, inflammation, and recovery stress
During illness, your resting heart rate and baseline energy demand can rise. Wearables may interpret this as higher metabolic activity. That can happen without any changes in movement.
Interpretation tip: If the increase coincides with feeling unwell, treat it as a physiological response rather than a fitness signal.
Caffeine, alcohol, dehydration, and heat
These factors can raise heart rate and affect sensor readings. Heat can increase skin blood flow and sweat, changing how the device interprets signals.
Interpretation tip: When comparing days, note whether caffeine timing, alcohol intake, hydration, or hot weather differed.
Sensor fit and motion artifacts
Wrist wearables can misread heart rate during activities with lots of wrist movement, loose straps, or poor contact. That can distort resting energy estimates.
Interpretation tip: Ensure a snug fit (without discomfort), and check whether heart rate data looks stable during sleep. If sleep heart rate is erratic, metabolism estimates may be less reliable.
How to validate wearable metabolism metrics at home
Because wearables estimate rather than measure, validation helps you understand how close the model is for your body.
Use a consistent “calibration” period
Pick a 10–14 day period where your routine is stable. Track your average daily calorie intake and compare it to your average daily weight trend. This does not require a perfect calorie count, but consistency matters.
Interpretation: If your intake is consistently higher than what your weight trend suggests, your wearable may be overestimating energy expenditure. If intake is consistently lower, it may be underestimating.
Look at weight trend, not daily weight
Daily weight fluctuates due to water balance. Use weekly averages or a moving average. If the trend is stable, it provides a better signal of energy balance.
Compare activity changes with energy changes
For example, if you add 30–60 minutes of brisk walking most days, you expect total calorie expenditure to increase. If your wearable shows no meaningful shift, the device may not be recognizing your activity well.
Interpretation: This is especially relevant for strength training or cycling. Ensure activity modes are selected when available, and confirm the device captured the session.
Understand what “accuracy” means for wearables
Even high-quality devices are not substitutes for lab measurements when it comes to exact RMR or metabolic rate. The most realistic goal is to determine whether the wearable captures direction and relative magnitude for your lifestyle.
For many people, that’s sufficient for planning training load, improving consistency, or identifying patterns that correlate with sleep and recovery.
Practical guidance for using metabolism metrics responsibly
Wearable metabolism data can be useful, but only when you use it in a way that matches how it’s generated.
Set expectations: estimate, don’t diagnose
Use metabolism metrics to support decisions like “my resting energy seems higher during stressful weeks” or “my total burn increases on training days.” Avoid using a wearable’s estimate to diagnose thyroid disorders, hormonal issues, or medical conditions.
Use context: pair metabolism metrics with sleep and recovery signals
When metabolism-related numbers change, check sleep duration, sleep regularity, resting heart rate trends, and activity consistency. If metabolism metrics rise alongside poor sleep and higher resting heart rate, that pattern is often more informative than the calorie number itself.
Watch for “algorithm drift” after updates or profile changes
Firmware updates and app changes can alter how metrics are calculated. Similarly, changing your entered weight, height, or activity goals can shift baseline estimates.
Interpretation tip: If you see sudden changes after an app update, treat the data as re-normalized and restart trend evaluation.
Be careful with aggressive calorie adjustments
Because metabolism metrics are estimates, large diet changes based on a single wearable output can overshoot. If you adjust intake, do it gradually and evaluate outcomes using multi-week trends in weight and performance.
How to interpret common scenarios
Below are practical ways to read metabolism metrics in real-life patterns.
Resting metabolic rate rises but activity stays the same
Likely explanations include stress, poor sleep, dehydration, caffeine, illness, or heat. If the increase lasts only a few days, it’s probably not a long-term metabolic change.
Total calories burned drop during a busy workweek
That can be a genuine change in daily movement. It can also reflect reduced activity recognition if your routine changes (e.g., more cycling or less walking). Confirm by checking step counts, active minutes, and whether exercise sessions were logged correctly.
Energy estimates increase after starting strength training
Strength training can raise heart rate and post-exercise recovery demands. Wearables may reflect this indirectly. However, the device may also undercount energy costs of lifting if movement patterns don’t match its model.
Interpretation tip: Look for changes in resting heart rate trends, sleep quality, and overall activity—not only total calorie estimates.
Metabolism metrics fluctuate widely day to day
Wide swings often correlate with inconsistent sleep timing, variable stress levels, or irregular exercise. Consider smoothing the data using weekly averages and comparing weeks with similar routines.
Summary: getting value from metabolism metrics without overinterpreting
Wearable metabolism metrics interpret your physiology through indirect signals like heart rate and movement. They can be helpful for understanding trends, identifying patterns connected to sleep and activity, and estimating whether your day-to-day energy expenditure is generally higher or lower. They are not precise lab measurements, and single-day changes often reflect temporary factors such as stress, illness, hydration, temperature, or sensor variability.
To use these metrics well, focus on multi-week patterns, validate with simple home checks like weight trend and routine changes, and interpret unexpected shifts with context. When a wearable’s numbers seem inconsistent, it’s usually a clue about inputs and modeling assumptions—not a sign that your metabolism has radically changed overnight.
Prevention guidance: reduce misreads and improve reliability
- Keep your profile updated when weight changes significantly.
- Wear the device consistently with a stable fit to reduce heart rate artifacts.
- Log exercise accurately when your wearable supports activity modes.
- Compare trends, not single days; use weekly averages for decisions.
- Account for confounders like illness, heat, caffeine, and sleep disruptions.
- Expect model changes after app or firmware updates; restart trend evaluation afterward.
09.04.2026. 18:08