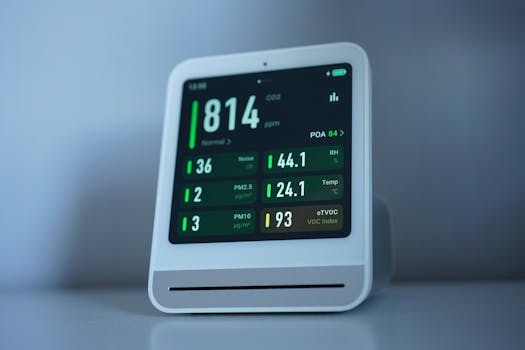
CO2 vs PM2.5 vs VOCs Indoor Air Quality
Why you should care about indoor air beyond “fresh smell”
Indoor air quality is one of those topics that sounds simple until you look closely. “Stale air” can mean many different things. It might mean you need more ventilation. It might mean fine particles are building up. It might mean chemical vapors are coming from paints, cleaning products, building materials, or even furniture.
To make sense of it, you need to separate what you’re breathing into categories. Three of the most discussed indicators are CO2, PM2.5, and VOCs (volatile organic compounds). Each one tells you something different. And each one requires a different response.
This guide helps you interpret what these measurements mean, where they come from, and how to improve the air in a practical way—without guesswork.
CO2: the ventilation signal, not the main poison
What CO2 actually is indoors
Carbon dioxide (CO2) is a gas you exhale. In most buildings, the indoor CO2 level rises mainly because people are breathing and the air isn’t being replaced fast enough. CO2 is not typically the chemical that directly damages lungs at indoor concentrations you’ll see in everyday life. Instead, it acts as a proxy for ventilation—a practical indicator that fresh air is or isn’t arriving.
When you’re in a room with other people, CO2 increases. If the ventilation rate is low, it can climb steadily. If ventilation is adequate, it stabilizes or stays near outdoor levels.
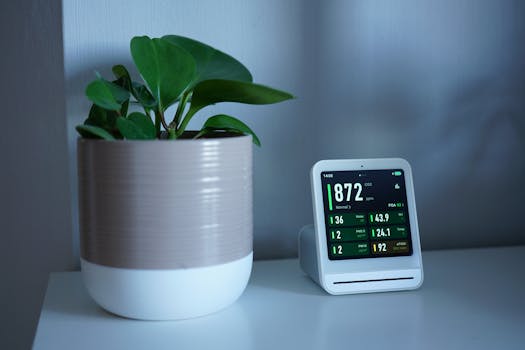
Typical indoor CO2 ranges you might encounter
Outdoor CO2 is commonly around 400–450 ppm (parts per million), though it varies by location and time of day. Indoors, CO2 can rise quickly in occupied spaces.
- ~600–800 ppm: often indicates good ventilation or low occupancy.
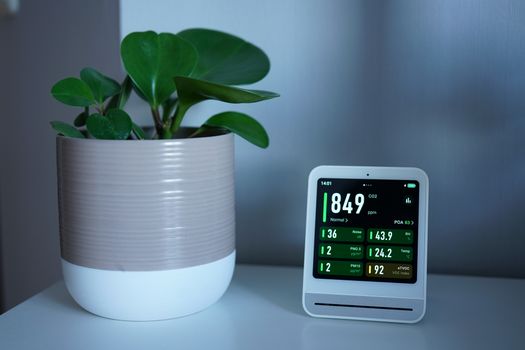
- ~800–1,000 ppm: commonly seen in moderately ventilated rooms.
- 1,000–1,500 ppm: suggests ventilation is likely insufficient for comfort and air freshness, especially if occupancy is steady.
- Above ~1,500 ppm: indicates a strong ventilation shortfall for occupied spaces in many real-world settings.
These aren’t strict health limits. They’re useful planning numbers. The key point is that elevated CO2 usually means higher levels of exhaled aerosols and other indoor contaminants may also be accumulating.
Common CO2 sources in homes and workplaces
CO2 sources are mostly biological and occupancy-driven:
- Occupants (breathing during sleep, work, school, and gatherings)
- Cooking and gas appliances can contribute indirectly by affecting ventilation patterns, though combustion gases are more directly associated with other pollutants
- Leaky or poorly balanced ventilation systems that don’t bring in enough outdoor air
In most residential contexts, occupant breathing is the dominant driver of CO2.
Health implications of high CO2 levels
CO2 itself can cause symptoms at higher levels, but in typical indoor ranges the more important issue is what CO2 represents: inadequate dilution of indoor air. When CO2 is high, you’re more likely to experience:
- Stuffy air and reduced perceived air quality
- Headaches or fatigue in some people
- Higher risk of airborne transmission of respiratory pathogens in shared spaces, because exhaled aerosols aren’t being cleared efficiently
In other words, CO2 is a ventilation compass. It doesn’t tell you the whole story, but it tells you whether your “air replacement” strategy is working.
PM2.5: the fine particle problem that can travel deep into lungs
What PM2.5 means and why it matters
PM2.5 refers to fine particulate matter with a diameter of 2.5 micrometers or smaller. These particles can come from combustion and mechanical processes. The smaller the particle, the deeper it can penetrate into your respiratory tract.
PM2.5 can enter indoors from outside air, and it can also be generated indoors. Because particles can stay suspended for long periods—especially in still air—PM2.5 is often a “persistent” metric compared with gases.
Where PM2.5 comes from indoors
In real homes, PM2.5 sources often include:
- Cooking, especially frying and high-heat cooking
- Smoking or vaping (including secondhand exposure)
- Wood burning stoves and fireplaces
- Candles and incense
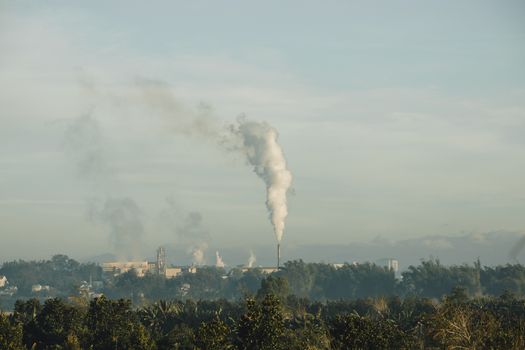
- Outdoor pollution infiltration during traffic congestion, wildfires, or industrial emissions
- Cleaning activities that stir up dust (dry sweeping, some vacuuming without good filtration)
During wildfire smoke events, PM2.5 can spike indoors even if you haven’t changed anything in your home. The particles come through windows, doors, and HVAC infiltration.
How PM2.5 affects health
PM2.5 is associated with respiratory and cardiovascular impacts. For many people, short-term exposure can aggravate asthma and other lung conditions. Fine particles can also influence inflammation and stress the heart.
People who may be more vulnerable include children, older adults, and those with heart or lung disease. Even if you feel “fine,” PM2.5 can be doing damage at the tissue level.
Real-world scenario: wildfire smoke and what you’d likely see
Imagine you live in a region where wildfires start 50–200 miles away. Outdoor air quality deteriorates rapidly. Within a day, your indoor PM2.5 readings may rise even if you keep windows closed. Why? Because particles infiltrate through HVAC systems and small gaps in the building envelope, and they deposit on surfaces and then re-suspend with airflow.
If you run air filtration and improve sealing and ventilation habits, PM2.5 can drop noticeably. But it typically won’t fall instantly unless filtration is strong and the building air exchange rate is low.
VOCs: the chemical vapors that come from products, materials, and activities
What VOCs are and how they behave indoors
VOCs (volatile organic compounds) are a broad category of carbon-based chemicals that can evaporate at room temperature. They’re often emitted from products and materials. Some VOCs are present at low levels all the time, but levels can rise after activities like painting, installing flooring, using certain cleaners, or even opening new furniture.
Unlike CO2, VOCs don’t primarily indicate ventilation. Unlike PM2.5, VOCs are not particles. They’re gases and vapors that can adsorb onto surfaces and then off-gas later. That means VOC problems can persist even after the initial source is removed.
Common indoor VOC sources
In your home or office, VOCs often originate from:
- Paints, primers, and adhesives
- New furniture (especially particleboard, laminates, and upholstery)
- Flooring and finishes (vinyl, laminate, sealants)
- Cleaning and disinfecting products
- Air fresheners and fragranced sprays
- Personal care products (hair sprays, some solvents)
- Gas stoves and combustion can contribute to VOC mixtures depending on combustion efficiency and ventilation
VOCs are also tricky because “VOCs” is a measurement umbrella. A detector may report total VOCs (tVOC), but the health relevance depends on which specific compounds are present.
Health effects linked to VOC exposure
VOCs can irritate eyes, nose, and throat. Some people experience headaches, dizziness, or nausea. Others notice symptoms like coughing or worsening asthma.
Longer-term exposure concerns depend on the chemical identity and concentration. Some VOCs are known or suspected carcinogens or reproductive toxins, but you generally won’t be able to infer that from a generic “TVOC” number alone. That’s why VOC monitoring should be paired with source awareness and practical mitigation.
Real-world scenario: “new home smell” and lingering VOCs
You move into a newly renovated space. For the first week, you notice a strong odor—maybe from fresh paint, new flooring, or adhesives used during installation. Even if the smell fades, VOC emissions can continue as materials off-gas.
In this scenario, CO2 might not be the issue at all. You could have good ventilation and still experience irritation. The most effective response is usually source control (what was applied) and ventilation strategies that reduce indoor concentration during the highest-emission period.
If you’re using a VOC sensor, it can help you see whether levels drop when you ventilate. But the sensor can’t tell you which chemicals are present—so you still need to treat the source responsibly.
CO2 vs PM2.5 vs VOCs indoor air quality: what each metric is telling you
The target phrase “CO2 vs PM2.5 vs VOCs indoor air quality” often comes up because people want one simple answer. The reality is that these metrics represent different processes:
- CO2 is an occupancy and ventilation proxy.
- PM2.5 is fine particle pollution from combustion, outdoor air, and indoor generation.
- VOCs are chemical vapors from products, materials, and activities.
It’s possible for one to be high while the others are low. For example, a crowded meeting room can have high CO2 without high PM2.5 or VOCs. Conversely, a home near a road can have elevated PM2.5 even if ventilation is decent and materials are old.
To manage indoor air effectively, you should ask three questions:
- Is the space ventilating? (CO2 helps you answer this.)
- Are particles accumulating? (PM2.5 helps you track this.)
- Are there chemical sources emitting vapors? (VOC readings plus source knowledge help.)
How to measure indoor air correctly (and avoid misleading readings)
CO2 monitoring: placement and interpretation
If you use a CO2 monitor, place it where people actually breathe—typically at about breathing height (roughly 3–5 feet / 1–1.5 meters above the floor). Avoid placing it directly next to supply vents, return grilles, or windows where it may read localized air streams rather than room-average conditions.
Also consider time. CO2 should be interpreted over periods that match your occupancy patterns. For instance, if a classroom is occupied from 9 a.m. to 3 p.m., look at how CO2 rises and whether it stabilizes by mid-day. A steady climb suggests ventilation is lagging behind occupancy.
PM2.5 monitoring: airflow effects and outdoor events
PM2.5 sensors can be influenced by nearby sources. Don’t place a sensor right next to a kitchen where cooking spikes will dominate the reading. Instead, place it in the general breathing zone of the room you’re assessing.
During outdoor events like wildfire smoke, compare indoor readings to outdoor air quality reports if available. If outdoor PM2.5 is high, indoor levels may track it with a delay depending on filtration and air exchange.
VOC monitoring: sensors are useful, but not definitive
VOC sensors vary widely. Some measure total VOCs using metal-oxide or electrochemical principles. These can respond to many different compounds and may drift over time. That doesn’t make them useless, but it means you should treat them as trend indicators, not precise chemical analyses.
Use VOC monitoring to answer questions like:
- Did levels drop after ventilation?
- Did levels spike after a specific activity (spraying, painting, cleaning)?
- Do levels remain elevated long after the activity stops?
For decisions like “is this safe,” you generally need a more detailed assessment, especially if you suspect specific hazardous compounds.
What to do when you detect problems: matching the solution to the pollutant
When CO2 is high: improve ventilation and air mixing
If you see CO2 rising above about 1,000–1,500 ppm during occupancy, the most reliable response is to increase fresh air and improve air distribution.
Practical steps include:
- Increase outdoor air through HVAC settings where possible (for example, higher fresh-air damper positions in commercial systems).
- Use spot ventilation in rooms where people gather (e.g., ensure bathroom/kitchen exhaust isn’t the only ventilation strategy).
- Improve mixing so air isn’t stagnant in one corner. Fans can help distribute air, but they don’t replace filtration or outdoor air.
- Shorten occupancy times for high-density spaces if ventilation upgrades aren’t immediate.
In bedrooms, CO2 can remain elevated overnight in tightly sealed rooms. If you wake with headaches or feel “stuffy,” ventilation during the evening and early morning can help—while also considering humidity control to prevent mold.
When PM2.5 is high: reduce sources and use filtration strategically
For PM2.5, you typically need two approaches: stop or reduce particle generation and remove particles from the air you can control.
Practical actions include:
- Control indoor sources: use proper range hoods, avoid burning candles during high-pollution periods, and keep smoking/vaping out of the home entirely.
- Upgrade filtration where it matters: HVAC filters with higher efficiency can reduce particle infiltration and recirculation. In many homes, portable HEPA air cleaners are a targeted solution for single rooms.
- Seal and manage infiltration: during smoke events, keep windows and doors closed and ensure HVAC is operating in a way that minimizes untreated outdoor air intake.
- Choose cleaning methods that don’t re-aerosolize: damp cleaning and vacuuming with good filtration can reduce dust resuspension.
Key measurement tip: after you start filtration or change ventilation habits, watch for a decrease over time. PM2.5 often drops over 15–60 minutes depending on air mixing, room size, and filtration strength.
When VOCs are high: identify and remove the source, then ventilate
VOC mitigation works best when you treat it like a source-and-air-exchange problem.
Steps you can take:
- Source control first: if you recently painted, installed flooring, or used a strong cleaner, treat that as the likely cause.
- Ventilate during the highest-emission window: the first hours to days after application often matter most. Keep outdoor air flowing rather than relying on recirculation alone.
- Reduce re-emission: if possible, allow materials to off-gas in ventilated conditions before occupying the space.
- Be cautious with “masking” products: air fresheners can add additional VOCs rather than solving the underlying issue.
If you’re using a VOC sensor, you can verify whether your actions are working by looking for a downward trend after ventilation. If VOCs stay elevated for weeks, that suggests either ongoing sources or materials that continue emitting.
How these pollutants interact in real life
Indoor air problems rarely come from one factor alone. Consider how they can overlap:
- Cooking and ventilation: cooking can raise PM2.5 and VOCs. If the exhaust fan is weak or the ventilation strategy is poor, you may also see CO2 rise because the room remains poorly ventilated.
- Renovations: new materials can elevate VOCs for weeks. If windows are kept shut to avoid outdoor pollution or noise, CO2 can rise because ventilation is reduced.
- Outdoor smoke events: wildfire smoke can raise PM2.5. In response, you might close windows, which can increase CO2 if you don’t compensate with mechanical ventilation that brings in outdoor air appropriately.
The best approach is to match your response to what’s actually happening. Otherwise, you can fix one problem while accidentally worsening another.
Practical guidance for homes: a simple decision path
You don’t need to become an environmental engineer to improve indoor air quality. A practical approach is to follow a sequence based on what you measure and when you measure it.
Step 1: Identify the time window and activity
Ask yourself what was happening when readings were high. Was there cooking? Were you using a strong cleaner? Did you host guests? Did you recently paint or install something?
Step 2: Check the pattern, not just a single number
- CO2 that climbs during occupancy suggests ventilation dilution is insufficient.
- PM2.5 spikes right after cooking or cleaning suggests a local source.
- VOC increases after a specific product or activity suggests off-gassing or chemical emissions.
Step 3: Apply the most direct mitigation
Use ventilation strategies for CO2, filtration/source control for PM2.5, and source control plus ventilation for VOCs. Then re-check readings after 30–120 minutes for particles and gases, depending on the pollutant and room conditions.
Workplace and school considerations: why CO2 often drives policy
Many organizations focus on CO2 because it is relatively easy to measure and it correlates with ventilation adequacy. In classrooms, offices, and meeting rooms, CO2 can rise quickly when occupancy is high and ventilation is unchanged.
A practical example: in a typical meeting room used for back-to-back sessions, CO2 may start near outdoor levels but rise above 1,000–1,500 ppm within an hour. If the room isn’t cleared with fresh air between meetings, CO2 stays elevated. That can be a sign that you need to adjust ventilation schedules, increase outdoor air, or incorporate air cleaning.
Even if you don’t manage the HVAC system directly, you can often take operational steps: ensure ventilation runs before and after occupancy, verify that air intakes aren’t blocked, and reduce occupancy density when feasible.
Prevention guidance: build a resilient indoor air strategy
You can prevent most recurring indoor air issues by treating ventilation, filtration, and source control as ongoing systems—not one-time fixes.
Ventilation habits that reduce CO2 and help overall air dilution
- Ventilate during high occupancy: before guests arrive, before meetings, and during activities that increase breathing load.
- In bedrooms, consider airflow strategies that balance fresh air with humidity control.
- If you use HVAC, confirm that fresh-air intake is functioning as intended.
Particle prevention for PM2.5
- Use cooking ventilation that actually removes air outdoors when possible.
- During wildfire smoke or heavy pollution days, keep windows closed and ensure filtration is running.
- Choose cleaning methods that don’t re-suspend dust.
Chemical source prevention for VOCs
- When you renovate, ventilate aggressively during the first days and consider scheduling occupancy after emissions decrease.
- Store solvents and strong chemicals in sealed containers.
- Prefer low-emission products when selecting paints, adhesives, and finishes—then ventilate to remove what the products emit.
Summary: using CO2, PM2.5, and VOCs together for better decisions
To manage CO2 vs PM2.5 vs VOCs indoor air quality, remember what each metric represents:
- CO2 tells you whether your indoor air is being diluted by outdoor air. High CO2 usually means ventilation is insufficient for the number of people and the time the space is occupied.
- PM2.5 tells you about fine particle pollution from indoor activities and outdoor infiltration. High PM2.5 calls for source control and particle removal through filtration and infiltration management.
- VOCs point to chemical vapors from products, materials, and activities. High VOCs call for source identification, ventilation during emission peaks, and time for materials to off-gas.
If you treat these as three separate signals rather than one “air quality score,” you’ll make better choices. Your goal isn’t to chase perfect numbers. It’s to reduce the underlying drivers—breathing buildup, particle generation, and chemical emissions—so the air in your home or workplace becomes consistently healthier.
16.02.2026. 01:46