PM2.5 VOC CO2 Sensor Readings for Sleep: What They Mean
Sleep quality is closely tied to the air you breathe, but “air quality” is not a single number. Modern indoor monitors often report PM2.5, VOCs, and CO2—three different signals that reflect different sources and different health-relevant mechanisms. Understanding what each reading means, how sensors behave overnight, and what levels are worth acting on can help you make targeted improvements rather than chasing noise.
This guide explains how to interpret PM2.5 VOC CO2 sensor readings for sleep, what typical bedroom patterns look like, and how to translate sensor data into practical ventilation and air-cleaning decisions. While sensor readings can be useful, they are not medical devices; the goal is to reduce exposures and improve conditions that support restful sleep.
Why PM2.5, VOC, and CO2 are different signals for sleep
Although these metrics often appear together on dashboards, they represent distinct aspects of indoor air:
- PM2.5 measures fine particulate matter (particles smaller than 2.5 micrometers). These particles can come from outdoor pollution infiltrating indoors, cooking aerosols, candles, smoking, and resuspension of dust. PM2.5 is associated with airway irritation and cardiovascular strain, so elevated levels can worsen breathing comfort—especially for people with asthma, allergies, or sensitive airways.
- VOCs (volatile organic compounds) measure a broad category of gases emitted from sources such as paints, solvents, cleaning products, adhesives, fragrances, and off-gassing from furnishings or building materials. Many VOC sensors are “total VOC” style indicators rather than identifying specific chemicals. VOCs can affect odor perception and may contribute to irritation for some people.
- CO2 is not a toxin at typical indoor concentrations, but it is a strong proxy for ventilation and exhaled breath accumulation. Higher CO2 often means less fresh air per person and can correlate with increased exposure to aerosols from occupants. For sleep, CO2 is relevant because it reflects how well the room is ventilated during the hours you are breathing most closely to your sleeping space.
Because these signals reflect different processes, you can see them move independently. For example, CO2 may rise steadily overnight even when PM2.5 stays low; or VOC levels can spike after cleaning while CO2 remains stable. Interpreting them together helps you identify the dominant issue at a given time.
Understanding PM2.5 readings overnight: thresholds and sensor behavior
PM2.5 sensors are often based on light scattering. They can be sensitive to particle size distribution, humidity effects, and the presence of aerosols that scatter light differently even if the mass concentration is similar. That means two sensors can disagree, especially at lower concentrations.
What “good” PM2.5 looks like for a bedroom
Practical sleep-focused guidance usually treats PM2.5 as a “lower is better” metric. Many indoor monitors show values in µg/m³. As a general reference framework:
- Very low: roughly under 10 µg/m³ is often typical of well-controlled indoor environments with limited indoor particle sources.
- Moderate: around 10–25 µg/m³ can occur during mild outdoor pollution, normal dust activity, or cooking residue that lingers.
- Elevated: above 25 µg/m³ suggests an active source or stronger infiltration from outdoors.
- High: above 35–50 µg/m³ often warrants immediate attention, especially if it persists through the night.
There is no universal “sleep safe” threshold, but persistent elevation is the key concern. A brief spike right after cooking or a neighboring event may be less meaningful than sustained levels while you are asleep.
Common PM2.5 patterns during sleep
- Gradual rise can indicate slow infiltration from outdoors during nighttime traffic or changes in atmospheric conditions.
- Sudden spikes often reflect indoor resuspension (walking on dusty floors, laundry agitation, HVAC cycling) or episodic outdoor events (smoke, construction, wildfire haze).
- Humidity-related artifacts can occur if your sensor reports PM2.5 that appears to increase when indoor humidity rises. Some particle types take up water and scatter more light, which can inflate readings.
How to interpret PM2.5 readings with ventilation and filtration
Before taking action, consider timing. If you open windows, PM2.5 may rise quickly if outdoor air is worse. If you run filtration, PM2.5 may drop with a delay depending on air mixing and filter performance.
For sleep, the most informative approach is to observe:
- Baseline: what PM2.5 does for 30–60 minutes before bed.
- Response: how quickly it changes after a ventilation event or filtration cycle.
- Persistence: whether levels remain elevated overnight.
Many people notice that running a high-efficiency air cleaner (when noise allows) reduces PM2.5 more effectively during the hours when windows are closed. If you use an air purifier, place it where it can mix air in the breathing zone, not in a corner with poor airflow.
VOC readings for sleep: why they can spike and how to read them responsibly
VOC measurement is more complex than PM2.5 because “VOC” is a group, and most indoor sensors estimate it indirectly. Some VOC sensors use metal-oxide or similar technologies, which respond to a range of gases but do not provide a chemical-by-chemical breakdown. As a result, the same VOC reading can reflect different compounds on different days.
Typical bedroom VOC sources
- Cleaning and disinfecting products (sprays, wipes, bathroom cleaners)
- Air fresheners and scented candles
- Paint, varnish, adhesives from recent renovations
- New furnishings (off-gassing from upholstery, mattresses, particleboard)
- Cooking residues that release gases as they cool
- Garages or adjacent rooms where solvents or fuels may be present
What VOC levels mean for sleep comfort
Because VOC sensors vary and may output values in arbitrary units, it’s harder to set universal cutoffs. Still, the pattern matters:
- Stable low VOC overnight suggests fewer ongoing emissions.
- Elevated VOC that peaks after specific activities indicates a source you can often remove or time-shift (e.g., ventilate during and after cleaning).
- Persistent VOC throughout the night may point to ongoing emissions from materials, carpeting, or hidden sources.
If your device provides a “TVOC” or “VOC index,” treat it as a relative indicator and focus on changes rather than exact numbers.
How ventilation affects VOC readings
Ventilation often reduces VOCs, but the direction depends on outdoor conditions and the timing of the emission. If you ventilate after applying a cleaner, VOC readings usually drop as the indoor air is exchanged. If outdoor air is polluted or smoky, VOC readings may not improve as expected.
For sleep, a common strategy is to avoid introducing new VOC sources near bedtime. If you must clean or use products, do it earlier in the day and ventilate adequately before going to sleep. Then confirm with your sensor that VOC readings return toward your room’s baseline.
Sensor limitations to keep in mind
- Cross-sensitivity: VOC sensors can respond to many compounds differently than humans perceive odor.
- Calibration variability: readings may not match another brand’s scale.
- Humidity and temperature effects: some sensor types drift with environmental conditions.
Because of these limitations, VOC sensors are best used to detect changes and persistence, not to identify whether one exact value equals a health risk.
CO2 readings for sleep: using it as a ventilation indicator
CO2 sensors are often the most straightforward of the three metrics. CO2 rises primarily from breathing and can also reflect ventilation rate and air mixing. While CO2 itself is usually not the direct cause of symptoms at typical indoor levels, it correlates with how much “exhaled air” is accumulating.
Baseline CO2 and what “normal” means
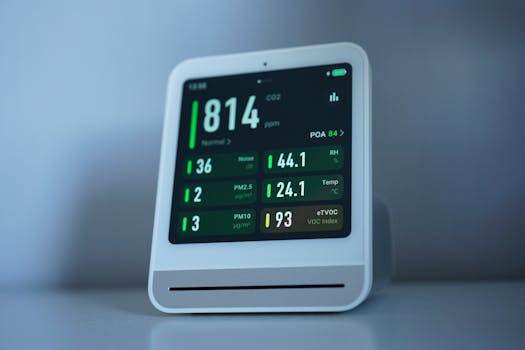
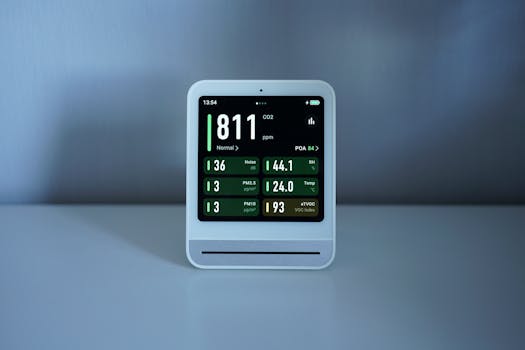
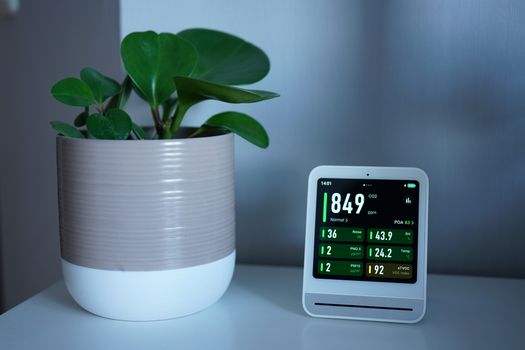
Outdoor CO2 concentrations vary, but a common outdoor baseline is often around 400–450 ppm. Indoors, CO2 can be much higher when windows are closed and occupancy continues.
- Near outdoor baseline (roughly 450–700 ppm): indicates good ventilation or low occupancy.
- Moderate indoor buildup (around 700–1000 ppm): ventilation is present but may be insufficient for long, dense occupancy.
- High buildup (1000–1500 ppm): often consistent with poor ventilation for sleep conditions.
- Very high (above 1500–2000 ppm): suggests inadequate fresh air exchange; it can be uncomfortable and may correlate with stale air and higher exposure to exhaled aerosols.
For sleep, the key is not only the peak but also whether CO2 remains elevated for hours. Since people spend long periods breathing in the same air, sustained CO2 suggests that ventilation is not sufficient during the entire night.
What affects CO2 overnight
- Occupancy: number of people and time in the room.
- Window/door position: even small leaks can change the rate of CO2 decline.
- HVAC operation: recirculation versus fresh air intake can change CO2 trends.
- Air mixing: CO2 may be higher near the head of the bed if airflow patterns trap exhaled air.
Practical ways to use CO2 data for better sleep conditions
A useful method is to run a “ventilation test” while awake:
- Note CO2 at the time you start making changes (e.g., closing windows, turning on HVAC, opening a window).
- Watch how quickly CO2 decreases over 20–40 minutes.
- Repeat when you return to your typical bedtime routine.
This helps you estimate whether your room’s ventilation is likely to keep CO2 from climbing too high during sleep.
If noise or temperature makes open windows difficult, consider solutions that maintain fresh air without large drafts. The sensor can confirm whether the approach lowers CO2 trends during the night.
How to interpret all three together: identifying likely indoor air problems
Interpreting PM2.5, VOC, and CO2 together helps you separate “ventilation problems” from “source problems.” Here are common scenarios you may see in a bedroom environment:
Scenario 1: CO2 rises, PM2.5 stays low, VOC stays stable
This pattern often indicates insufficient fresh air exchange rather than particulate or chemical emissions. The likely action is ventilation-related: adjust fresh-air settings, improve air exchange, or change how long windows remain closed.
Scenario 2: VOC spikes after cleaning or cooking, CO2 remains moderate
VOC changes usually reflect emissions from activities or materials. The key is timing and removal: ventilate during/after the activity and verify that VOC returns to baseline before bedtime.
Scenario 3: PM2.5 spikes coincide with outdoor events, CO2 rises slowly
If PM2.5 tracks outdoor pollution or smoke infiltration, filtration and air sealing become more relevant than ventilation alone. You may still need ventilation for CO2, but you’ll want to balance it with particle control (for example, using filtration during periods when outdoor PM2.5 is high).
Scenario 4: All three rise during the same timeframe
When PM2.5, VOC, and CO2 increase together, it can indicate a combined cause: poor ventilation plus indoor sources (like cooking, scented sprays, or smoking) plus outdoor infiltration. In these cases, reducing the source and improving air exchange at the right times typically produces the clearest improvement.
Bedroom placement, sampling time, and data quality
Sensor readings can be influenced by where and how the device samples air. For sleep-related decisions, placement matters because you want the measurement to reflect the breathing zone.
Where to place sensors for meaningful sleep readings
- Height: place the sensor at roughly breathing height when possible (often around 1–2 meters from the floor), not on the floor or right next to the ceiling.
- Distance from direct sources: avoid placing the sensor directly in front of a diffuser, in the path of a strong fan, or immediately adjacent to an air purifier outlet.
- Avoid dead zones: corners and behind furniture can trap air and misrepresent the average exposure.
- Consistency: keep placement constant when you test ventilation or filtration changes so you can compare days fairly.
Use trends rather than minute-to-minute noise
Many indoor sensors update frequently, but readings can fluctuate due to sensor response time, airflow turbulence, and intermittent sources. For sleep, it’s often more useful to look at:
- Average overnight level
- Maximum during sleep
- Time spent above your baseline
If your device supports it, review data in time windows (e.g., 11 pm–7 am). This reduces overreaction to short spikes.
Understand how devices handle calibration and reporting
Some PM2.5 sensors require warm-up, and some VOC sensors drift with time. CO2 sensors may have periodic baseline behavior depending on the model. If your device has calibration guidance, follow it. Also consider that “factory calibrated” does not always mean “accurate to a reference instrument.”
If you have access to trusted outdoor air quality data or a second monitor, you can use it to sanity-check your PM2.5 trends. For VOC and CO2, trend-based interpretation is usually more reliable than chasing exact numeric equivalence between brands.
Practical steps to reduce PM2.5, VOC, and CO2 exposure while sleeping
Improving sleep air quality generally involves three levers: source control, ventilation strategy, and filtration/air cleaning. Your sensor readings help you decide which lever to pull.
Reduce PM2.5 at night
- Filter particles: run appropriate filtration during the hours when windows are closed, especially when outdoor PM2.5 is high.
- Avoid indoor particle generation: skip candles, incense, and smoking near bedtime. If cooking is necessary, use kitchen ventilation and allow time for particles to settle before sleep.
- Minimize resuspension: reduce dust disturbance close to bedtime (for example, avoid heavy vacuuming right before lying down).
- Seal when outdoor air is worse: if your PM2.5 rises when you ventilate, keep windows closed during smoke or high pollution events and rely on filtration.
Reduce VOCs before sleep
- Time-shift emissions: perform cleaning, painting, or use of strong products earlier, then ventilate and wait until readings return to baseline.
- Choose low-emission routines: avoid heavily fragranced sprays and strongly scented products in the bedroom.
- Let new materials off-gas: if furnishings are new, allow off-gassing in a ventilated area rather than sealing them in the bedroom immediately.
- Ventilate strategically: if outdoor VOC levels are unknown, rely on source control first. Your sensor can confirm whether ventilation reduces VOC readings.
Manage CO2 with ventilation that you can sustain
- Ventilate before sleep: reduce CO2 buildup by exchanging air earlier in the evening.
- Use a ventilation method you can keep running: HVAC fresh air settings, window cracking (if safe and comfortable), or mechanical ventilation can maintain lower CO2 overnight.
- Improve air mixing: ensure airflow is not trapping exhaled air near the head of the bed.
- Re-check after changes: CO2 should respond over 20–60 minutes depending on room volume and airflow.
Where relevant, consider device reporting and “sleep mode” settings
Some indoor monitors and air cleaners include “sleep mode” that reduces fan speed or changes sampling behavior to lower noise. This can affect PM2.5 reduction rates and the measured environment. If you enable sleep mode, monitor whether PM2.5 and CO2 trends still remain within your comfort targets overnight. The goal is not silence at any cost, but stable air quality while you rest.
In many homes, it can be helpful to keep a monitor running continuously and use its data to confirm that your nighttime routine—windows, HVAC, and filtration—actually delivers the air you expect.
Prevention guidance: building an overnight air-quality routine
Instead of reacting to single readings, create a routine that aligns with how these pollutants behave across a day:
- Before bed: check baseline PM2.5 and VOC levels; ventilate if needed to bring CO2 down.
- Avoid introducing new sources: stop activities that generate VOCs or particles close to bedtime.
- Confirm overnight stability: review data for the entire sleep window. Look for sustained elevations rather than one-off spikes.
- Adjust one variable at a time: if you change ventilation strategy, keep filtration settings constant for a few nights to interpret the results.
- Use seasonal context: heating seasons and wildfire seasons change outdoor infiltration patterns and indoor humidity, which can affect PM2.5 and sensor behavior.
Over time, you’ll learn your room’s “normal” ranges. For sleep, that knowledge is often more actionable than chasing a universal number.
Summary: turning PM2.5, VOC, and CO2 readings into sleep-ready decisions
PM2.5, VOC, and CO2 sensors answer different questions:
- PM2.5 tells you about fine particles from outdoors and indoor activities; persistent elevation overnight is the main concern.
- VOC indicates changes in airborne organic compounds; use sensor trends to identify sources and confirm that levels return to baseline before sleep.
- CO2 is a practical ventilation proxy; sustained high CO2 overnight suggests insufficient fresh air exchange.
For the most useful sleep-focused interpretation, focus on overnight trends, understand sensor limitations, and coordinate actions around source control, ventilation, and filtration. When you do that, your PM2.5 VOC CO2 sensor readings for sleep become a guide for reducing exposures during the hours that matter most.
15.03.2026. 18:46