

HRV vs Blood Pressure Variability: What It Means for Your Health

Two variability signals, different physiology: HRV vs blood pressure variability

When you hear “variability,” it can sound like the same thing across different health metrics. It isn’t. HRV (heart rate variability) and blood pressure variability both describe fluctuations over time, but they come from different control systems and respond to different stressors.
In practical terms, HRV is about how your autonomic nervous system modulates the time between heartbeats. Blood pressure variability reflects how tightly your cardiovascular system—via vessel tone, baroreflexes, renal regulation, and breathing-related hemodynamics—keeps blood pressure stable.
To compare them, you need to know how each is measured. HRV is typically derived from beat-to-beat intervals (often from ECG or a validated wearable). Blood pressure variability is usually calculated from repeated blood pressure readings taken over short windows (minutes to 24 hours) using an upper-arm cuff or ambulatory blood pressure monitoring (ABPM). Both can be expressed as standard deviation, average real variability, or spectral components, depending on the protocol.
Because the signals come from different pathways, the same lifestyle factor—poor sleep, alcohol, illness, training load, stress—may change HRV and blood pressure variability in different directions or at different speeds. That’s why the question “HRV vs blood pressure variability what it means” matters: interpretation depends on what you’re actually measuring and why.
Quick summary: which one is strongest overall?
If your goal is to understand autonomic recovery and stress load, HRV is usually the more direct and sensitive signal, especially when you track it consistently (e.g., morning HRV over weeks). If your goal is to understand cardiovascular stability and regulation—particularly in relation to hypertension risk—blood pressure variability often provides more clinically specific information, especially when measured with ABPM across a full day.
Overall: HRV tends to win for day-to-day neuroautonomic insight. Blood pressure variability tends to win for cardiovascular regulation and risk-related patterns.
Side-by-side comparison: what each metric measures
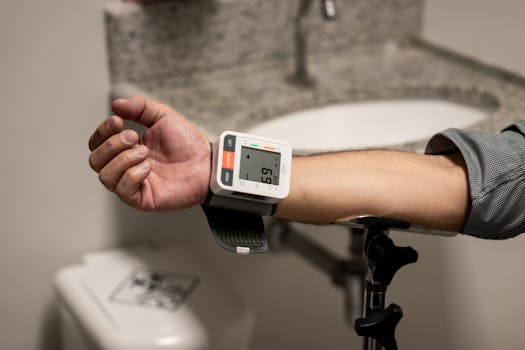
Below is a practical comparison focusing on what the measures represent, how they’re calculated, and what changes usually mean.
| Dimension | HRV (Heart Rate Variability) | Blood Pressure Variability |
|---|---|---|
| Core meaning | How much the time between heartbeats varies due to autonomic (sympathetic/parasympathetic) regulation | How much blood pressure changes over time due to cardiovascular control systems (baroreflex, vascular tone, renal and hormonal effects) |
| Primary physiology | Autonomic nervous system and respiratory-cardiac coupling | Vessel tone and reflex buffering of pressure; also influenced by breathing and activity patterns |
| Common measurement methods | ECG-derived RR intervals; validated wearables; short recordings (e.g., 1–5 minutes) or nightly recordings | Repeated cuff readings; ABPM (often every 15–30 minutes); sometimes home BP series |
| Common metrics | SDNN, RMSSD, pNN50; frequency-domain measures (LF/HF) in some contexts | Standard deviation (SD), coefficient of variation (CV), ARV (average real variability); day/night variability indices |
| Time scale | Seconds-to-days; often analyzed over minutes or across nights; trends over weeks matter most | Minutes-to-24 hours (ABPM); also assessed across seasons or treatment periods in clinical studies |
| Typical sensitivity | High sensitivity to sleep quality, recovery, stress, illness, and training load | Sensitive to fluctuations in vascular regulation, adherence to medication timing, hydration, caffeine/alcohol, and circadian rhythm |
| Direction of change in common scenarios | Often decreases with acute stress, poor sleep, overreaching, or infection; can increase with recovery | Often increases with unstable regulation, missed medication, high sympathetic drive, or poor sleep; patterns vary by individual |
| Best for interpreting | Autonomic balance, readiness, recovery trends, and short-term physiological strain | Cardiovascular stability, hypertension risk markers, and how consistently your system controls pressure |
| Major confounders | Arrhythmias, measurement noise, movement artifacts, breathing rate differences, inconsistent measurement timing | Measurement technique, cuff placement, talking/movement during readings, irregular schedules, medication timing |
| How clinicians often use it | Adjunctive marker in some contexts (e.g., autonomic function, recovery); research in cardiac and metabolic health | Risk-related marker in hypertension and cardiovascular outcomes research; used with ABPM for more complete profiles |
What “variability” really means in the real world
Think of your body as a control system. HRV reflects the “steering” of heart timing. Blood pressure variability reflects the “buffering” of pressure. Both are normal—your body is supposed to adapt. The issue is whether the adaptation looks healthy and flexible or unstable and stressed.
For HRV, a key idea is that higher HRV (within your personal baseline) often indicates stronger parasympathetic influence and better recovery capacity. But it’s not universally “more is always better.” Some people naturally have lower HRV and still function well. Also, certain conditions can produce misleading HRV patterns depending on how the metric is computed and what you’re measuring (e.g., ectopic beats affecting RR intervals).
For blood pressure variability, the concept is similar but the interpretation is often more risk-oriented. Greater variability—especially across day/night periods—can indicate that your cardiovascular system has less effective buffering. That doesn’t mean every spike is dangerous in the moment. It means the system is less consistent over time.
Real-world performance differences: where each measure shines
Let’s ground this in day-to-day use. Suppose you’re monitoring your physiology during a demanding training block.
Scenario 1: Heavy training week and sleep disruption
During a week where you train hard and get fragmented sleep, you may see your HRV drop in morning readings or overnight recordings. That makes sense: autonomic balance shifts toward sympathetic dominance and away from parasympathetic recovery. The change can appear within 24–72 hours, sometimes earlier.
Meanwhile, your blood pressure variability may increase, particularly if your workouts spike sympathetic drive and your sleep loss worsens vascular regulation. If you use ABPM, you might notice larger swings in systolic pressure between readings. The variability might be most obvious during the day when activity and stress are highest, and less so overnight if your circadian rhythm remains intact.
However, the relationship isn’t guaranteed. Some people maintain stable blood pressure despite reduced HRV. Others see blood pressure variability change first. That’s why treating one measure as a universal proxy can lead you astray.
Scenario 2: Medication timing and inconsistent control
Imagine you take blood pressure medication in the morning, but on a few days you delay the dose due to a schedule change. Over time, your blood pressure variability may increase—especially in the hours before the next dose—because the pharmacodynamic effect is shifting. ABPM can capture this pattern across the day.
Your HRV might not change dramatically, particularly if your autonomic nervous system is stable and you’re not experiencing major stress or sleep changes. Or HRV may show some shift if your body responds to the pressure changes via reflex pathways, but the timing and magnitude can differ.
This scenario highlights a key distinction: blood pressure variability is often more directly tied to cardiovascular regulation and medication effects, while HRV is more sensitive to autonomic and recovery state.
Scenario 3: Acute illness vs chronic cardiovascular risk
With a viral illness, HRV often shows a noticeable decline early—sometimes before you feel fully “sick,” because autonomic function is affected. Blood pressure variability can also change, but it may be less specific: fever, dehydration, pain, and reduced sleep can all influence blood pressure variability, and the direction can vary.
Over longer horizons (months to years), research links blood pressure variability to cardiovascular outcomes more consistently in many clinical cohorts. HRV is also studied for risk prediction, but it’s frequently interpreted alongside other markers and clinical context.
Pros and cons breakdown: HRV
Where HRV is strong
- High day-to-day sensitivity: HRV can respond quickly to sleep quality, stress, and recovery. Many people see meaningful changes within 1–3 days.
- Autonomic specificity: HRV is tightly connected to autonomic regulation and respiratory-cardiac coupling, especially when you use consistent measurement conditions.
- Actionable trends: Tracking HRV over weeks can help you detect patterns like “HRV drops after late nights” or “HRV rebounds after deload weeks.”
- Low friction: When you use validated wearables or a home ECG device, you can collect data frequently without repeated cuff inflation.
Where HRV can mislead
- Measurement quality matters: Motion artifacts, poor skin contact, and ectopic beats can distort RR intervals. If your HRV metric suddenly changes without a plausible reason, check data quality.
- Confounding by breathing: Breathing rate changes can influence HRV via respiratory sinus arrhythmia. If you measure at different times of day or under different breathing patterns, comparisons get noisier.
- Not a direct blood pressure proxy: HRV and blood pressure variability are related through shared autonomic pathways, but they don’t always move together. A stable HRV doesn’t guarantee stable blood pressure variability.
- Metric differences: SDNN, RMSSD, and frequency-domain measures aren’t interchangeable. If your device reports one metric and you compare it to another study using a different one, you can misinterpret magnitude.
Pros and cons breakdown: blood pressure variability
Where blood pressure variability is strong
- Cardiovascular regulation focus: It reflects how consistently your body maintains pressure through baroreflex buffering, vascular tone, and hormonal/renal effects.
- Clinical relevance for hypertension: Variability—especially across day/night periods—has been studied as a risk marker in cardiovascular outcomes research and is commonly assessed using ABPM.
- Captures timing patterns: ABPM can reveal “when” variability happens (morning surge, midday dips, evening spikes), which can be missed by a single office reading.
- Medication effect visibility: If adherence or pharmacokinetics shift, blood pressure variability often reveals it more clearly than HRV.
Where blood pressure variability can mislead
- Cuff and protocol variability: Small differences in cuff placement, arm position, or talking during readings can add noise. Technique matters more than many people expect.
- Short-term “spikes” can overstate meaning: If you calculate variability from a few readings taken irregularly, the metric can be unstable and not representative of your true regulation.
- Less responsive to acute autonomic shifts: HRV may change quickly with stress or recovery. Blood pressure variability may lag or be influenced by many other factors (hydration, caffeine, activity).
- Individual baseline matters: Two people can have different “normal” variability due to age, fitness, vascular stiffness, and autonomic tone.
Best use-case recommendations for different buyers
“Best” depends on what you’re trying to learn. Below are practical recommendations based on common buyer goals, without assuming you’re purchasing anything specific.
If you want autonomic recovery insight (sports, stress, sleep)
Choose HRV as your primary metric. Your best results come from consistent measurement: same time of day, similar posture, and preferably after you’ve been still for a short period (often 1–5 minutes for short recordings). Many people track morning HRV because it reflects overnight autonomic balance. Over time, you can look for patterns such as:
- HRV decreases after late-night screen time or alcohol (often within 24 hours).
- HRV drops during high training load and rebounds after a deload.
- HRV becomes more erratic when you’re under-recovered or ill.
In this use-case, blood pressure variability can be a secondary signal, especially if you notice dizziness, headaches, or known hypertension. But HRV is usually the more direct tool for day-to-day autonomic state.
If you want cardiovascular stability and hypertension risk context
Choose blood pressure variability, ideally with a structured protocol such as ABPM. If you’re trying to understand whether your blood pressure control is stable across the day and night, variability is more informative than a single average value.
Look for patterns like:
- Higher variability in the morning or evening, which may suggest inconsistent control or circadian disruption.
- Day-night differences that don’t follow expected circadian patterns.
- Increased variability when medication timing changes or when you miss doses.
HRV can still add context—especially if you suspect autonomic dysregulation—but blood pressure variability is closer to the cardiovascular question.
If you want both perspectives (a more complete physiological picture)
Use HRV and blood pressure variability together when you want to distinguish “autonomic strain” from “vascular/pressure instability.” The combination can help you ask better questions:
- HRV down, blood pressure variability stable: you may be under-recovered without major pressure regulation issues.
- HRV stable, blood pressure variability up: consider medication timing, hydration, caffeine/salt effects, or vascular regulation changes.
- Both down/up in the same direction: stress or illness may be affecting both autonomic and cardiovascular control systems.
This approach is especially useful if you have known hypertension, are managing cardiovascular risk, or have symptoms that don’t match a single metric.
Final verdict: which metric suits your needs?

For most people trying to interpret physiology day-to-day, the strongest overall choice is:
- HRV if you’re focused on autonomic balance, recovery, sleep impact, and training/stress readiness. It’s often more sensitive to changes within 24–72 hours.
- Blood pressure variability if you’re focused on cardiovascular stability, hypertension-related risk context, and how consistently your body controls pressure across the day and night—best captured with ABPM or a structured series.
If you need one metric to start, pick based on the question you’re actually asking. If your concern is “How stressed and recovered am I?” HRV is usually the more direct answer. If your concern is “Is my blood pressure regulation consistent and stable?” blood pressure variability is usually the more meaningful signal.
And if your goal is clarity rather than certainty, using both metrics can reduce ambiguity. The key is to interpret them on their own terms—different physiology, different time scales, different sources of noise—so you can make decisions grounded in what each measure truly represents.
Note on measurement quality (why it changes the outcome)
Even the best metric can become unreliable if the measurement process is inconsistent. For HRV, ensure good signal quality and consistent conditions. For blood pressure variability, ensure proper cuff technique and adequate sampling. Variability is a statistic; garbage-in produces misleading variability.
If you want to compare changes over time, avoid switching devices or protocols midstream. A change in hardware, sampling window, or calculation method can look like a biological change even when the physiology hasn’t changed.
13.03.2026. 05:08