Homeostasis vs Allostasis: Wearables Metrics for HRV and Resting HR
Why “homeostasis” vs “allostasis” matters for wearable metrics
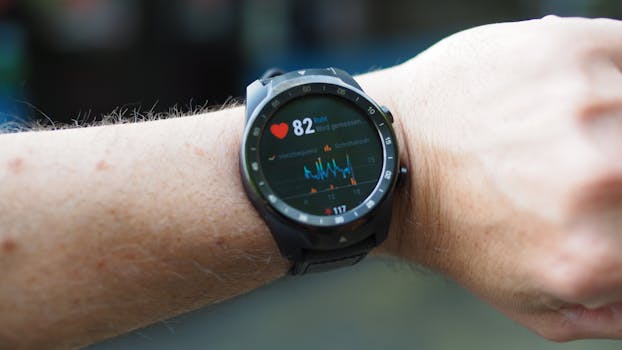
Wearables can track heart rate, resting heart rate, and heart rate variability (HRV) with surprising consistency. But one common mistake is treating these numbers as direct readouts of a single biological state. Systems biology frames the issue differently: the body is not simply trying to stay constant (homeostasis); it continuously adapts to changing demands (allostasis). That distinction helps explain why HRV and resting heart rate sometimes “move in the wrong direction” if you expect a static, equilibrium-like interpretation.
This myth-busting article connects the concepts of homeostasis vs allostasis to how wearables measure HRV and resting heart rate—so you can interpret patterns more responsibly and avoid common misreadings.
Homeostasis vs allostasis: the core idea in plain biological terms
Homeostasis refers to regulatory processes that keep internal conditions within relatively stable ranges. Classic examples include maintaining core temperature or blood glucose within bounds. The emphasis is on stability and feedback control that corrects deviations.
Allostasis shifts the emphasis from stability to adaptation. Instead of keeping a single variable constant, the system anticipates and responds to changing conditions by adjusting multiple physiological parameters. Allostasis can be efficient in the short term, but chronic or repeated adjustments can contribute to wear and tear—a concept sometimes summarized as “allostatic load.”
For wearable interpretation, the key takeaway is this: a change in HRV or resting heart rate is not automatically evidence of “good” or “bad” physiology. It may reflect adaptive control, measurement context, or competing processes happening simultaneously.
Myth: Wearables measure “homeostasis” as one objective number
A persistent myth is that HRV and resting heart rate are direct biomarkers of homeostatic balance. In reality, both metrics are indirect signals shaped by multiple inputs:
- Autonomic nervous system activity (sympathetic and parasympathetic balance)
- Respiration patterns, which strongly influence HRV
- Sleep stage distribution and whether the device captured true rest
- Motion artifacts and how the algorithm filters them
- Metabolic state (hydration, caffeine, food timing, glucose dynamics)
- Inflammation and immune activity (including delayed effects)
Because HRV and resting HR are emergent outcomes of many interacting systems, the “homeostasis vs allostasis” lens is more accurate than the “one number equals balance” mindset.
What HRV actually captures (and what it doesn’t)
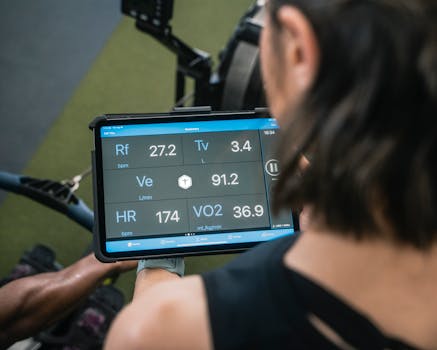
HRV refers to variability in the time intervals between heartbeats. Many wearables report HRV using time-domain measures (like RMSSD) or frequency-domain features, depending on the device and processing pipeline.
Educationally accurate interpretation
HRV is often used as a proxy for autonomic flexibility. Higher HRV is frequently associated with greater parasympathetic (vagal) influence and better recovery capacity, but it is not universally “better.” In allostatic terms, HRV can decrease if the body increases sympathetic drive to meet a demand—or if stressors (physical, psychological, infectious, or environmental) alter autonomic control.
Why HRV can look inconsistent across days
HRV is sensitive to context. For example:
- Respiratory rate and breathing depth can change HRV even when “stress” is unchanged.
- Sleep timing and sleep quality can shift HRV because autonomic patterns differ across sleep stages.
- Training load and recovery can alter HRV through both immediate and delayed mechanisms.
- Illness onset may produce gradual HRV changes before symptoms are obvious.
These are all plausible allostatic adjustments. So when you see an HRV dip after a hard day, it might indicate a temporary adaptation and recovery process—not necessarily a failure of homeostasis.
Resting heart rate: a homeostatic-looking metric with allostatic behavior
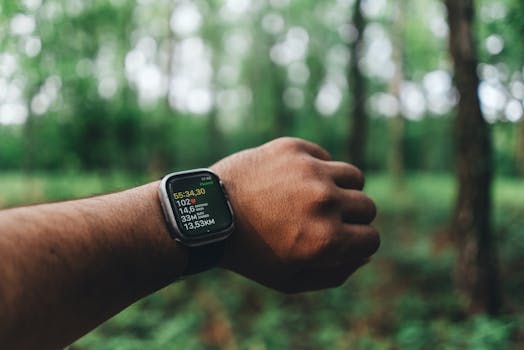
Resting heart rate (RHR) is commonly derived from the lowest heart rates recorded during a time window, often overnight or during inactivity. Many people treat RHR as a stable “baseline.” But RHR is influenced by adaptive physiology.
How allostasis can raise or lower RHR
RHR can increase when the body shifts into a higher-demand control mode. Examples include:
- Reduced sleep quality
- Dehydration or electrolyte imbalance
- Alcohol effects
- Infection or inflammation
- Heightened sympathetic tone due to stress
- Thermoregulatory demands (heat, cold exposure)
Conversely, RHR can decrease with better recovery, improved conditioning, or effective stress reduction. The allostasis lens helps you interpret RHR as a dynamic output of regulatory adjustment, not a fixed “set point.”
Myth: HRV rising means you’re “fully recovered,” and HRV falling means you’re failing
Wearables often encourage binary thinking, but biology is rarely binary. HRV changes are influenced by multiple overlapping processes. A short-term HRV decrease can occur during adaptive training, while a later HRV increase may reflect recovery—or may reflect changes in sleep timing, breathing, or measurement conditions.
Similarly, an HRV increase does not automatically mean the body is “back to baseline.” In allostasis, the system may operate at a new equilibrium that is better suited to current demands. That means recovery is not always “return to prior numbers.” It can be “successful adaptation to the new load.”
Myth: Homeostasis vs allostasis can be read directly from a single wearable trend
Another common misunderstanding is expecting you can label a trend as “homeostatic” or “allostatic” from HRV or RHR alone. The concepts are systems-level descriptions of regulation. Wearables provide partial observations—useful, but not complete.
To connect the theory to practice, think in terms of pattern context:
- Stable baseline with small fluctuations may resemble homeostatic control under typical conditions.
- Shifts after stressors (sleep disruption, training blocks, travel, illness) with subsequent adaptation may reflect allostatic regulation.
- Prolonged elevation of RHR or persistent HRV suppression can be consistent with high allostatic load, especially if accompanied by other signals (sleep disruption, fatigue, reduced performance).
Even then, the wearable reading is a clue, not a diagnosis.
How to interpret wearable HRV and RHR using an allostasis-aware workflow
If you want practical guidance, focus less on single-day judgments and more on structured interpretation.
1) Start with within-device consistency
Different devices calculate HRV differently and may use different filtering and sleep-detection logic. If you use a specific wearable, interpret trends within that same device and within similar data-processing conditions.
2) Use time windows that match physiology
HRV and RHR can shift after acute stressors, but recovery and immune effects often show delayed patterns. Consider:
- Overnight HRV for recovery and sleep-related autonomic changes
- Multi-day RHR trends for broader load and inflammation signals
- Training blocks and rest days as contextual anchors
3) Pair metrics with context that changes autonomic balance
Track variables that commonly drive HRV and RHR:
- Sleep duration and bedtime variability
- Caffeine timing
- Alcohol intake
- Exercise intensity and duration
- Travel across time zones
- Illness symptoms (even mild)
This improves your ability to distinguish adaptive allostasis from measurement noise.
4) Watch for “stuck” patterns rather than single spikes
Myth-busting rule: one day rarely tells the whole story. More informative signals are sustained changes that persist across days, especially when they co-occur with functional changes (fatigue, reduced workout capacity, disrupted sleep).
Relevant wearable features and why they affect interpretation
Wearables vary in how they estimate “resting” periods and how they compute HRV. Some platforms provide nightly HRV summaries, while others offer short-session HRV measurements. Sleep detection algorithms can differ, which affects whether HRV is calculated during true rest or during fragmented sleep.
Natural examples of “products” in this context include widely used categories such as wrist-based HRV tracking and overnight RHR summaries from mainstream consumer wearables and smartwatches. Even when two devices are both “HRV trackers,” their measurement pipelines can differ enough that cross-device comparisons are unreliable.
So, when applying homeostasis vs allostasis thinking, prioritize: trend interpretation within one device and context-aware judgment over absolute thresholds.
Prevention guidance: reduce misinterpretation and avoid overcorrection
Allostasis is adaptive, but it can become costly when demands are high and recovery is insufficient. Wearables can help you notice when the system is under strain, yet they can also tempt you into unnecessary anxiety-driven behavior (overtraining adjustments, unnecessary fasting, or constant metric checking).
Practical prevention steps
- Avoid single-metric panic: interpret HRV and RHR together with sleep, training, and illness context.
- Look for convergence: if HRV is suppressed and RHR is elevated over multiple nights/days, that’s more actionable than a one-off reading.
- Respect measurement constraints: movement artifacts and poor sleep detection can distort values.
- Use functional outcomes: pair metrics with how you feel and perform, not only with numbers.
If you have medical concerns—especially symptoms like chest pain, fainting, sustained shortness of breath, or unusual palpitations—wearable metrics are not a substitute for clinical evaluation.
Summary: a systems view for homeostasis vs allostasis wearables metrics
The myth to discard is the idea that HRV and resting heart rate directly measure “homeostasis” as a single stable state. A more accurate systems biology framing is that these metrics reflect outputs of ongoing regulation. Homeostasis emphasizes stability; allostasis emphasizes adaptive change under shifting demands. Wearables provide partial, context-sensitive signals—especially HRV, which is strongly influenced by sleep and breathing, and RHR, which can shift with autonomic tone, hydration, inflammation, and recovery.
Interpreting homeostasis vs allostasis in wearable metrics becomes practical when you focus on within-device trends, multi-day patterns, and context pairing rather than binary judgments about “recovered vs not recovered.”
13.03.2026. 05:26