

Best Wearable Metrics for Libido & HRV: What Actually Tracks Desire

What you’re really trying to measure: libido signals vs. HRV physiology
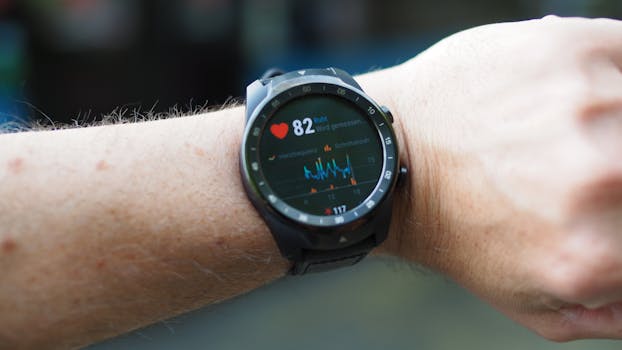
You’re not just shopping for “HRV.” You’re trying to connect two things that don’t always move together: autonomic nervous system balance (where HRV is a proxy) and libido (a mix of hormones, stress, sleep, relationship context, and arousal). Wearables can’t measure desire directly, but they can track the body states that tend to precede it.
This article compares the best wearable metrics for libido HRV—meaning the metrics that most reliably correlate with changes in your libido over time. We’ll look at HRV-derived measures (like RMSSD), trend logic (day-to-day vs. long-term), and “supporting” metrics (resting HR, sleep stages, skin temperature, and readiness scores). Then we’ll translate those differences into real-world performance: what you’ll notice on your wrist, and what you can reasonably act on.
Quick note on expectations: your libido can spike for reasons HRV can’t capture (relationship dynamics, novelty, cycle timing, porn use, medication changes). The goal is not prediction perfection. The goal is useful signal—metrics that help you spot windows when your body is more receptive.
Quick summary: the strongest overall option for “libido-friendly” HRV tracking
If you want one practical approach that works across brands, prioritize:
- HRV trend (preferably RMSSD-based) over single-day HRV values
- Resting heart rate (RHR) trend to confirm recovery (lower is usually better)
- Sleep duration + consistency as the baseline driver of HRV stability
In practice, the most useful “overall” signal on many wearables is a readiness-style score built from HRV + resting HR + sleep. Garmin’s Readiness and Oura’s readiness-style interpretation are strong examples of how vendors combine metrics into something you can actually use.
But the best choice depends on whether you want high-resolution HRV (more granular recovery tracking) or actionable libido-adjacent context (sleep and recovery patterns packaged into a score).
Side-by-side: best wearable metrics you can use for libido and HRV
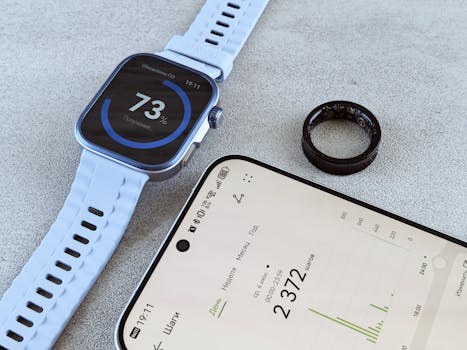
The table below compares the metrics that matter most when you’re trying to connect HRV with libido. It focuses on what each metric is, what it tends to reflect physiologically, and how well it supports libido tracking in real life.
| Metric (what you’ll see) | What it measures / estimates | Why it can relate to libido | Best for | Where it’s commonly found | Key limitation |
|---|---|---|---|---|---|
| HRV (RMSSD) trend | Vagal tone and parasympathetic activity; many wearables estimate it from night data | Higher recovery/relaxation often coincides with better sexual receptivity | Tracking “your baseline” and spotting recovery windows | Oura (HRV/RMSSD-based), Garmin (HRV), Whoop (HRV), Polar (HRV) | Single-day HRV is noisy; libido is multi-factor |
| HRV stability (variance over 7–30 days) | Consistency of your HRV pattern rather than just the level | More stable recovery patterns can align with more predictable desire | Long-term libido trend mapping | Most platforms via graphs; best when you can view history | Requires time; not great for “today” decisions |
| Resting heart rate (RHR) trend | Overall cardiac strain and recovery state | Lower RHR often corresponds to reduced stress load | Confirming whether HRV changes are “real recovery” | Garmin, Oura, Fitbit, Apple Watch (with caveats) | RHR can shift with caffeine, hydration, illness |
| Readiness / Recovery score | Composite score built from HRV, RHR, sleep, temperature, activity | Libido often tracks “I feel good” days more than raw HRV | Actionable day-to-day guidance | Garmin Readiness, Oura Readiness, Whoop Recovery | Opaque weighting; not transparent metric-by-metric |
| Sleep duration + regularity | Total sleep and consistency of timing | Sleep loss can reduce testosterone/estrogen signaling and increase stress | Building a libido baseline you can trust | Oura, Fitbit, Garmin, Whoop, Apple Watch (sleep) | Sleep tracking accuracy varies by device fit |
| Sleep stages (REM/Deep %) | Estimates of REM and deep sleep from motion/PPG | REM relates to arousal networks; deep sleep supports recovery | Explaining libido changes after poor nights | Oura (strong sleep staging), Apple Watch, Garmin | Stage estimates can be less reliable than total sleep |
| Skin temperature trend (night mean + rise) | Peripheral temperature changes; often affected by recovery/inflammation | Higher stress/inflammation can lower libido; temperature can flag illness | Separating “stress” from “sickness” periods | Oura, some Garmin models, Whoop (limited) | Not a direct libido signal; interpret trends |
| Respiratory rate (if available) | Breathing rate estimate from PPG | Breathing patterns influence HRV; stress often raises RR | Stress-context for HRV | Some Oura features; limited on many wearables | Estimates can drift; less standardized |
| Breathing rate + paced breathing sessions | Measured breathing pattern and HRV response during sessions | Controlled breathing can increase HRV and improve relaxation | Interventions you can do today | Oura (breathing guidance), Garmin (breathing), Apple Watch | Improves HRV; doesn’t guarantee libido immediately |
Real-world performance differences: what changes when you track these metrics
To make this practical, imagine you track libido using a simple 0–10 rating each day (or after intimacy). You also log HRV-based data automatically from your wearable.
Scenario: You notice your libido dips on days when your HRV is lower. But sometimes HRV drops after workouts, even though you still feel “turned on.” That’s where the differences between metrics matter.
Here’s what usually happens when you track the right signals:
- HRV level vs. HRV trend: A single low HRV night can happen from poor sleep, alcohol, dehydration, or even a restless partner. Your libido may still be fine. When you look at a 7-day HRV trend, the pattern becomes clearer: libido tends to be higher when your HRV trend is improving, not just when one night is low.
- HRV without RHR confirmation: If HRV drops but RHR also stays stable, it may be a transient measurement artifact or mild stress. When HRV drops and RHR rises over 2–3 days, libido often follows a more consistent downward pattern.
- Sleep stages help explain “why”: If your total sleep is stable but REM drops, you might feel less emotionally “open” or less playful—even if recovery looks okay on paper. Sleep stages are not perfect, but they can explain outliers.
- Skin temperature flags “not today” periods: When temperature trends upward (often from inflammation or illness), you may see HRV changes and libido suppression together. That’s a useful separation—this isn’t just stress; it’s recovery load.
The biggest performance gap between wearables isn’t that one has “better HRV.” It’s that devices differ in:
- How they compute HRV (RMSSD vs. other methods)
- How much data they use (night-only vs. more frequent monitoring)
- How they present trends (raw values vs. composite readiness)
- How accurate their sleep and temperature estimates are for your body and fit
Pros and cons breakdown: each metric approach that supports libido tracking
Instead of ranking entire brands, we’ll rank metric approaches—because the “best wearable metrics for libido HRV” depends on how you want to use the data.
1) RMSSD-style HRV trend (raw HRV graphs)
What you get: A time-series of HRV values (often RMSSD-derived) that you can compare across nights.
Pros
- Most direct HRV signal for autonomic balance
- Best for personalization: you can find your own thresholds (e.g., “when my 7-day HRV average is above X, libido is higher”)
- Works even when your readiness score is vague
Cons
- Noisy day-to-day—movement, alcohol, stress, and fit issues can distort it
- Harder to act on immediately unless you watch trends
- Libido isn’t purely autonomic, so correlation won’t be perfect
Where it shines: If you like data and you’re willing to review trends over 2–4 weeks, RMSSD HRV trend is one of the most reliable ways to connect physiology with desire windows.
2) Readiness / recovery composite score (HRV + RHR + sleep)
What you get: A single number or label that tries to summarize whether you’re recovered.
Pros
- More actionable for “today”—you don’t have to interpret HRV graphs
- Confirms HRV with other signals (sleep quantity, resting HR, sometimes temperature)
- Reduces false alarms when HRV dips due to a single odd night
Cons
- Opaque weighting: you may not know whether HRV or sleep drove the score
- Can hide your personal pattern if the algorithm doesn’t match your physiology
- Different ecosystems can make comparisons tricky if you switch devices
Where it shines: If you want to plan intimacy around recovery without becoming a full-time data analyst, readiness scores are a strong “best overall” route.
3) Resting heart rate (RHR) trend as a stress/recovery validator
What you get: A daily measure of your baseline heart rate.
Pros
- Easy to interpret: higher RHR often means more strain
- Helps validate HRV so you don’t overreact to a single low HRV night
- Often more stable than HRV for some people
Cons
- Less specific to autonomic balance than HRV
- Can swing from lifestyle factors (caffeine timing, dehydration, late meals)
- Some devices estimate RHR differently, so absolute values aren’t always comparable
Where it shines: When libido changes feel inconsistent, RHR trend can explain whether your HRV drop is “recovery” vs. “stress load.”
4) Sleep duration + regularity (the foundation metric)
What you get: Total sleep time, and often sleep timing consistency.
Pros
- Strong driver for both HRV and libido through stress hormones and fatigue
- Often the easiest lever to improve (bedtime and wake time)
- Improves interpretability: if libido drops, you can check whether sleep debt increased
Cons
- Not a direct libido metric
- Sleep staging accuracy varies—but duration is usually more reliable than REM estimates
Where it shines: If you’re trying to see patterns over a month, sleep regularity is often the clearest “why” behind HRV and desire shifts.
5) Sleep stages (REM/deep estimates)
What you get: Estimated percentages or durations of REM and deep sleep.
Pros
- Can explain emotional/arousal changes beyond recovery
- Useful for outliers when HRV looks fine but libido doesn’t match
Cons
- Stage estimation isn’t perfect across devices
- More sensitive to wear position and sensor quality
Where it shines: For people who notice libido depends on mood and dreaminess (or who feel “wired but not receptive”), sleep stages can add context.
6) Skin temperature trend (illness/inflammation context)
What you get: Nighttime temperature trends, sometimes with “recovered vs. stressed” interpretation.
Pros
- Great for spotting “not today” physiology (illness, inflammation, recovery load)
- Often complements HRV when stress is physical, not just psychological
Cons
- Not specific to libido
- Interpretation depends on baseline—your normal matters
Where it shines: When you want to distinguish “stress reduced my desire” from “my body is fighting something.”
7) Respiratory rate and breathing-guided HRV response
What you get: Estimated breathing rate and sometimes guided breathing sessions that aim to improve HRV.
Pros
- Actionable intervention: you can influence HRV in-session
- Helps separate stress from recovery (breathing patterns often shift with stress)
Cons
- Immediate libido effects aren’t guaranteed
- Estimates vary—breathing rate from PPG can drift
Where it shines: If you’re the type who wants to do something with the data today—breathing sessions can improve your state even if libido still depends on other factors.
Best use-case recommendations: which metric approach fits your goals
Use the sections below to choose what to emphasize based on how you intend to use your wearable for libido tracking.
You want the most accurate “libido window” tracking (data-first)
Choose: RMSSD-style HRV trend + RHR trend.
Why: Libido tends to correlate with recovery and reduced strain. HRV gives you autonomic balance; RHR confirms whether your body is actually carrying less load. Together, they reduce misleading signals.
Practical setup: Review your 7-day HRV average and your RHR trend together. Look for days where HRV is rising and RHR is stable or falling. Track libido for 3–4 weeks to learn your pattern.
Device examples to consider: Oura (strong HRV presentation), Whoop (recovery focus), Polar (detailed HRV), Garmin (HRV + readiness views).
You want an easy “today vs. not today” signal (action-first)
Choose: Readiness / recovery composite score as your primary metric, with HRV trend as a secondary check.
Why: Composite scores smooth out noise. They also incorporate sleep, which is a major driver for both HRV stability and libido.
Real-world example: On a week where you’ve been traveling, your HRV might dip due to schedule changes. A readiness score that also considers sleep duration and RHR will often flag “recovery is low.” That’s more useful than obsessing over a single low HRV night when your libido might already be influenced by jet lag and mood.
Device examples to consider: Garmin Readiness (recovery framing), Oura Readiness (sleep + HRV + temperature context), Whoop Recovery (recovery emphasis).
You’re trying to understand “why my libido dropped” (context-first)
Choose: Sleep duration/regularity + sleep stages + skin temperature trend, then check HRV to confirm.
Why: If libido drops but HRV doesn’t move much, it could be sleep quality, emotional stress, or physical recovery load. Temperature can also separate illness-like periods from psychological stress.
Device examples to consider: Oura (temperature + sleep context), Garmin (sleep + recovery), Apple Watch (sleep and heart metrics, with variability).
You want to improve HRV on purpose (intervention-first)
Choose: Breathing-guided HRV response plus your usual HRV trend.
Why: If you can reliably raise HRV through paced breathing, you can test whether your body responds with improved relaxation—which is a common prerequisite for desire. You’re not just observing; you’re experimenting.
Practical example: If you notice libido dips on high-stress days, try a 5–10 minute breathing session in the evening for 7 days. Compare HRV the next night and your libido rating that day. Even if libido doesn’t spike immediately, you’ll learn whether your stress-to-desire pathway is responsive to calming interventions.
Device examples to consider: Oura (breathing guidance), Garmin (respiratory/breathing features), Apple Watch (breathing app).
Detailed metric-to-metric differences you’ll feel (and why some devices “seem better”)
People often say one wearable “tracks libido better” than another. Usually, what they mean is that one device presents the right metric in the right way for their routine. Here are the most common differences that change your results.
Night-only HRV vs. broader sampling
Many wearables estimate HRV best during sleep because the signal is cleaner. If your HRV is derived mainly from nighttime data, it will correlate more with next-day libido than with immediate arousal.
That’s not a failure—it’s a physiological reality. HRV is sensitive to stress and recovery, but libido can spike quickly due to cues. So you’ll often see HRV correlate with readiness and mood rather than instant desire.
Composite scores vs. raw numbers
Composite scores can look “better” because they reduce noise. But if you want to understand your personal pattern, raw HRV graphs can be more revealing.
Think of it like this: readiness scores are a weather forecast. Raw HRV is the barometer. Forecasts help you decide what to wear today; barometers help you understand why the weather changed.
Sleep staging differences
Sleep stages can be useful, but they’re less standardized than HRV. If one wearable consistently reports higher REM on your best libido days, that’s valuable for you. If another wearable’s REM doesn’t match your subjective experience, you’ll want to lean more on total sleep and consistency.
Skin temperature and “illness filtering”
Temperature trends can help you avoid false conclusions. If your HRV is down because you’re getting sick, libido might drop even if your stress levels are normal. Temperature gives you an extra lens.
This is especially helpful if you track libido weekly and you sometimes see unexplained dips.
How fit affects what you see
Wear position and sensor contact matter. Poor fit can degrade PPG signals, which can make HRV graphs look erratic. When your HRV looks chaotic for no lifestyle reason, check the band tightness and consistency before changing your plan.
For many users, a stable fit improves HRV consistency within 1–2 weeks, which then makes libido correlations clearer.
Pros and cons breakdown by “best metric winners” (clear picks)
Below are the clearest winners by goal. This is where you’ll decide what “best” means for your situation.
Winner for personal HRV-libido correlation: HRV trend (RMSSD-style) + RHR
Why it wins: It’s the most physiologically direct approach while still validating with a second marker. You get both autonomic balance and strain context.
Tradeoff: Requires you to look at trends, not single days.
Winner for day-to-day usefulness: readiness / recovery score
Why it wins: It’s designed to be interpretable on the same day. If you want “more likely libido days,” readiness tends to deliver.
Tradeoff: You may not know exactly which input drove the score.
Winner for explaining weird libido dips: sleep + skin temperature context
Why it wins: It helps you separate “stress recovery” from “physical load/illness” and sleep-driven mood changes.
Tradeoff: More metrics to review, and sleep stage estimates can vary.
Winner for interventions: breathing-guided HRV response
Why it wins: It gives you an experiment you can run without changing your whole lifestyle.
Tradeoff: Immediate libido changes aren’t guaranteed; you’re mainly improving relaxation and recovery signals.
Final verdict: which option suits different needs
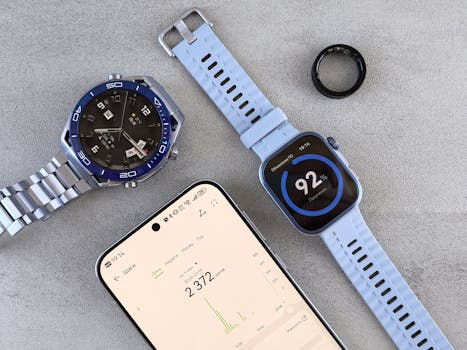
Here’s the practical answer to “what are the best wearable metrics for libido HRV?”
- If you want the best overall signal for predicting your libido windows: focus on HRV trend (RMSSD-style) plus RHR trend. This combination is the most likely to reflect the body state that supports desire.
- If you want the easiest day-to-day guidance: use a readiness/recovery composite score as your primary metric, and glance at HRV trend only when you need clarification.
- If your libido tracking feels inconsistent and you want explanations: emphasize sleep duration/regularity and add skin temperature trend to filter out illness-like periods. Then use HRV to confirm recovery.
- If you want to actively improve your state: use breathing-guided HRV sessions and compare outcomes over 7–14 days, rather than expecting instant libido changes.
Your best wearable metric approach is the one that matches how you live. If you review daily and want action, composite readiness wins. If you want to understand your physiology, raw HRV trends with RHR validation wins. And if you keep getting “mystery dips,” sleep + temperature context will usually give you the missing piece.
25.04.2026. 03:59