

HRV vs resting heart rate vs respiratory rate: What to track

Why these three signals matter for your nervous system
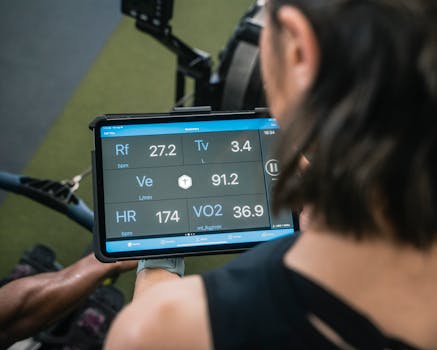
If you’ve ever looked at a smartwatch or fitness tracker and wondered what all the numbers mean, you’re not alone. HRV, resting heart rate, and respiratory rate are often shown together because they each reflect different parts of physiology—especially how your body regulates stress, recovery, and autonomic balance.
But they are not interchangeable. HRV (heart rate variability) is not “just another heart rate.” Resting heart rate is not a direct measure of nervous system control. Respiratory rate is a window into breathing control and metabolic demand. When you track all three, you get a more complete picture of what your body is doing.
In this science explainer, you’ll learn what each metric measures, what typical ranges look like, why trends matter more than single-day values, and how to use them in real-world situations—without overreacting to normal fluctuations.
HRV: measuring the timing patterns your autonomic system controls
What HRV actually measures
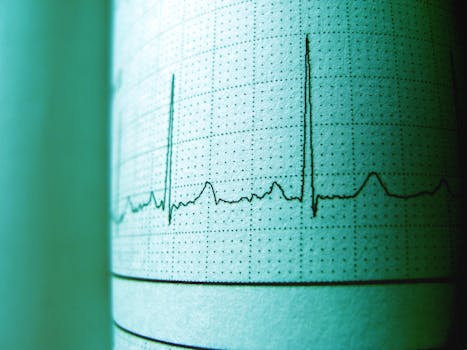
Heart rate variability (HRV) describes the variation in time between consecutive heartbeats (often called R–R intervals). Your heart doesn’t beat like a metronome. Instead, the interval between beats changes continuously as your body responds to breathing, posture, sleep stages, stress, and recovery.
HRV is commonly reported as:
- RMSSD (root mean square of successive differences): sensitive to short-term changes and often used in consumer devices.
- SDNN (standard deviation of normal-to-normal intervals): influenced by longer recording windows.
- pNN50 (percentage of intervals differing by more than 50 ms): less common in consumer summaries.
Most wearable “daily HRV” values are derived from nighttime recordings, typically when you’re still and breathing patterns are relatively stable. This matters because HRV is strongly affected by movement and measurement conditions.
Why HRV is tied to your nervous system
Your autonomic nervous system has two major branches:
- Sympathetic activity (often associated with “mobilization” or stress responses)
- Parasympathetic
HRV tends to be higher when your parasympathetic influence is stronger and your system can flex efficiently. HRV often drops during acute stress, illness, overreaching, poor sleep, or dehydration. It can also drop with certain medications or conditions that affect heart rhythm regulation.
Importantly, HRV is not a direct “stress score.” It’s a physiologic output reflecting how your body’s control systems are coordinating heart timing.
What counts as normal HRV—and why individuals vary
There isn’t a single universal “normal” HRV value. HRV varies widely by age, fitness, sleep quality, baseline autonomic tone, and even how the device detects beats. Two people can have very different HRV values and both be healthy.
That’s why trends are usually more informative than absolute numbers. A meaningful pattern is a sustained change relative to your own typical baseline—especially over 3–7 days.
Resting heart rate: a simple number with complex meaning
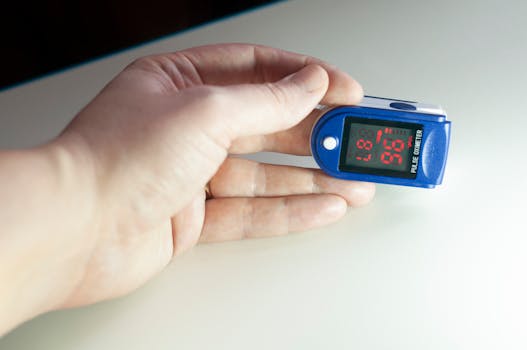
What resting heart rate measures
Resting heart rate (RHR) is your heart rate when you’re at rest—commonly measured upon waking or during sleep. Typical adult RHR values often fall somewhere around 60–100 bpm, but many healthy, physically active people are lower (often 40–60 bpm), and some healthy individuals run higher.
RHR is influenced by multiple factors:
- Cardiac efficiency and fitness
- Hydration status and electrolyte balance
- Sleep quality
- Stress hormones (like adrenaline and cortisol)
- Illness or inflammation
- Temperature and altitude
Because RHR aggregates many influences, it can change even when HRV doesn’t, and vice versa.
How RHR relates to the nervous system
RHR is often discussed as an indicator of autonomic balance, but it’s more indirect than HRV. When sympathetic activity rises or parasympathetic tone drops, your heart rate can increase. However, RHR also reflects intrinsic cardiac properties and long-term conditioning.
In practical terms, RHR can be useful for spotting broad shifts—like being run down, under-slept, or coming down with something—especially when you see a consistent elevation above your normal range.
Timeframes: acute changes vs baseline shifts
RHR can react quickly to acute factors (poor sleep, a stressful day, caffeine). Baseline RHR changes more slowly, sometimes over weeks to months, depending on training load and overall health.
As a rule of thumb:
- Day-to-day RHR spikes often reflect immediate stressors or measurement context.
- Week-long upward trends can align with illness, persistent fatigue, or insufficient recovery.
If your RHR rises by, say, 5–10 bpm above your typical morning average for several days, it’s worth paying attention—especially if HRV falls at the same time.
Respiratory rate: breathing control, oxygen demand, and stress
What respiratory rate measures
Respiratory rate (RR) is the number of breaths per minute. In healthy adults at rest, a common range is roughly 12–20 breaths per minute, though individual values vary. Some devices estimate RR from motion and breathing waveforms, while others use dedicated sensors.
Respiratory rate is shaped by:
- Carbon dioxide (CO₂) levels and ventilatory drive
- Metabolic demand (even subtle changes in energy use)
- Airway resistance and lung mechanics
- Stress and anxiety (which can alter breathing patterns)
- Pain, fever, or illness
RR can increase during fever or respiratory infections, and it can also rise with anxiety or after caffeine.
Why RR can change when HRV and RHR don’t
Because RR is closely linked to ventilatory control, it may respond to factors that don’t strongly affect heart timing early on. For example, if you’re congested or your breathing feels “workier,” RR may increase even if your heart rate seems relatively stable.
Conversely, HRV can drop due to autonomic imbalance even if RR remains unchanged—especially in purely nervous system–driven stress where metabolic demand doesn’t spike much.
Measurement matters: the accuracy problem
RR is harder to measure reliably than heart rate. Consumer devices often estimate it indirectly, which can be influenced by:
- Sleep position and movement
- Sensor placement
- Breathing pattern changes not captured well by the algorithm
For that reason, RR trend interpretation usually works best when you compare your own baseline over time and focus on meaningful multi-day patterns rather than single values.
HRV vs resting heart rate vs respiratory rate: what each one adds to the story
Different physiological “layers” of the same system
Think of your body’s regulation as layered:
- HRV reflects beat-to-beat timing variability—strongly influenced by autonomic control.
- RHR reflects how fast your heart runs at rest—affected by autonomic tone, conditioning, and systemic load.
- RR reflects ventilatory drive and breathing mechanics—affected by CO₂ regulation, stress, and illness.
When you compare them, you’re essentially comparing different outputs of the control system. Sometimes they change together. Sometimes they separate, which can be informative.
Common pattern: stress or poor recovery
A frequently seen pattern during poor recovery is:
- HRV decreases (reduced variability and flexibility)
- RHR increases (more sympathetic influence or lower parasympathetic tone)
- RR may increase (stress or subtle metabolic changes)
This combination can suggest your nervous system is under strain or your body is not fully recovering.
Common pattern: illness or inflammatory state
Respiratory rate may be especially helpful when illness is involved. For example, if you’re coming down with a respiratory infection, you may see:
- RR increases even at rest
- RHR rises
- HRV drops
Not everyone shows every metric change, but the overlap can strengthen your interpretation.
Common pattern: training load and fatigue
During heavy training blocks, you may notice HRV trending down and RHR trending up even without feeling overtly sick. RR can remain stable if the changes are primarily autonomic rather than metabolic or respiratory.
This is one reason HRV is often used for “readiness” discussions in sports science: it can reflect autonomic adjustments before you feel major symptoms.
How to interpret trends without chasing noise
Use your baseline, not someone else’s numbers
Because HRV and RHR vary between individuals, your best reference is your own historical pattern. Establish a baseline by looking at typical values during a stable period—often a few weeks—then watch for deviations.
If you use a wearable, consider tracking:
- Morning HRV (or nighttime HRV summary)
- Morning RHR
- Average RR at rest or during sleep
Look at 3-day to 7-day averages when possible. Single-day changes can be caused by late meals, alcohol, travel, poor sleep, a stressful meeting, or simply a different sleep stage composition.
A practical example: the “Monday slump” after travel
Imagine you travel across time zones on a weekend. On Sunday night, your sleep is shorter and your late-night meal is heavier. On Monday morning you notice:
- HRV is lower than your usual by a noticeable margin
- RHR is slightly higher
- RR is a bit elevated during sleep
You don’t feel dramatically ill. In this scenario, the most likely explanation is disrupted sleep and autonomic recalibration due to travel. Over the next 3–4 days, as your sleep schedule normalizes, HRV should partially rebound and RHR should settle.
If the elevated RR and lowered HRV persist for a week or you develop symptoms like fever or a worsening cough, the interpretation shifts toward illness rather than travel disruption.
When a change is “actionable” vs “just a blip”
In general, more confidence comes from:
- Consistency across multiple days
- Concordance (e.g., HRV down while RHR up)
- Context (did you sleep poorly, get sick, or have a hard workout?)
- Symptom alignment (fatigue, sore throat, shortness of breath, fever)
A single low HRV night doesn’t automatically mean something is wrong. A week of downward HRV alongside rising RHR and increasing RR is a stronger signal that your system is not fully recovered.
Practical guidance: how to use HRV, RHR, and RR in daily life
Standardize measurement conditions as much as possible
To interpret trends credibly, you should reduce variation caused by measurement context. Practical steps include:
- Check metrics at a consistent time (often right after waking)
- Avoid intense movement immediately before collecting “resting” readings
- Keep sleep timing relatively consistent during baseline tracking
- Use the same device and placement when possible
If you switch devices, algorithms can change. HRV and RR values may not be directly comparable across brands.
Use them to guide recovery decisions, not diagnoses
You can use these metrics to help decide how hard to train, how much to rest, or whether to pay extra attention to sleep and hydration. But they are not diagnostic tools.
For example, if HRV drops and RHR rises for several days, it may be wise to reduce training intensity, extend recovery, or prioritize sleep. If RR increases markedly along with symptoms like chest tightness or fever, that calls for medical attention rather than self-experimentation.
Simple “if-then” interpretations you can actually apply
Here are practical scenarios you can map to your own data:
- If HRV drops and RHR rises for 3+ mornings, consider that recovery may be insufficient. Try earlier sleep, reduce intensity, and ensure hydration.
- If RR rises while you feel unwell (sore throat, cough, fever), illness becomes more likely. Monitor symptoms and consider contacting a clinician if symptoms escalate.
- If HRV is low but RHR is unchanged, the shift may be more autonomic than systemic—or it could be measurement variability. Look for patterns over several days.
- If RR increases after caffeine or stress and resolves when those factors pass, the change may be situational rather than a persistent health issue.
These are not medical rules, but they reflect how the metrics tend to behave in everyday physiology.
What to do when metrics conflict
Sometimes you’ll see mixed signals. For instance, HRV might be slightly down while RHR is stable, and RR is normal. That could mean:
- You had a stressful day that affected autonomic balance without changing overall resting load
- You had a minor sleep disruption that altered HRV but not your broader resting physiology
- Your device’s algorithm captured a different sleep stage distribution
In these cases, don’t force a single explanation. Use your symptoms and a multi-day window to decide whether to adjust training or take a rest day.
Common pitfalls and how to avoid misinterpretation
Overreacting to one “bad night”
HRV is sensitive. Alcohol, late meals, poor sleep, and even a slightly different breathing pattern can reduce HRV temporarily. If your HRV drops once but rebounds the next night, it’s often not a health emergency.
Ignoring measurement quality
Wrist-based HRV depends on accurate pulse detection. Motion artifacts and weak signal can distort HRV calculations. If your wearable flags low-quality data or you wore it differently than usual, treat HRV results cautiously.
Assuming respiratory rate is always accurate
RR estimates can be less reliable than heart rate. If your RR changes dramatically but your sleep logs, symptoms, and HR metrics don’t support illness or stress, consider that the RR estimate may be noisy.
Confusing athletic adaptation with illness
Regular endurance training can reduce RHR and sometimes improve HRV over time. But during illness or overreaching, HRV can drop and RHR can rise. The key is the pattern over time and whether you have symptoms.
Prevention and recovery guidance: supporting your autonomic balance
Sleep is the most consistent lever
Because HRV and RHR strongly reflect recovery state, sleep quality is usually the highest-impact factor you can control. Aim for consistent sleep timing and sufficient duration—often 7–9 hours for many adults.
If you notice HRV drops repeatedly, check sleep drivers first: bedtime consistency, room temperature, late caffeine, and alcohol timing.
Manage training stress with a multi-metric view
When you’re increasing training load, watch for a combined pattern: HRV trending down, RHR trending up, and RR rising or feeling “breathless” at rest. If that happens, consider reducing intensity or volume for a few days.
Many athletes use a simple approach: if readiness metrics worsen for several days, they shift to easier sessions rather than pushing through.
Hydration and nutrition affect all three
Dehydration can raise resting heart rate and may affect HRV. Undereating can increase stress hormones and alter breathing patterns. If you’re training hard or in hot weather, hydration and electrolytes matter for both performance and recovery.
Know when to seek medical input
Wearable metrics can’t replace clinical evaluation. You should seek prompt medical advice if you have symptoms such as:
- Chest pain, fainting, or severe shortness of breath
- Fever with marked worsening breathing or persistent high RR
- New irregular heartbeat sensations
- Rapid sustained changes that don’t match known stressors
In those situations, treat the symptoms as primary. Metrics can support context, but they shouldn’t delay care.
Summary: using HRV, resting heart rate, and respiratory rate together
HRV vs resting heart rate vs respiratory rate is best understood as three different physiological lenses:
- HRV reflects beat-to-beat timing variability and is strongly influenced by autonomic nervous system regulation.
- Resting heart rate reflects how fast your heart runs at rest and can increase with stress, poor sleep, illness, or systemic load.
- Respiratory rate reflects ventilatory drive and breathing mechanics, often rising with fever, respiratory illness, anxiety, or increased metabolic demand.
For everyday use, prioritize your trends over single-day values. Look for patterns across 3–7 days, especially when HRV decreases while RHR increases and RR also trends upward. Use context—sleep, training, travel, and symptoms—to interpret what the numbers likely mean.
Above all, treat these metrics as guidance for recovery and awareness. They can help you notice when your nervous system and body are under strain, but they don’t replace medical diagnosis when symptoms suggest a health problem.
29.03.2026. 03:42