
Wearable Focus Metrics: HRV, RHR, Sleep & Respiration Guide

Why wearable focus metrics matter for real productivity
Wearables are no longer just step counters. Many now estimate “focus” or “readiness” using a mix of physiological signals—especially heart rate variability (HRV), resting heart rate (RHR), sleep staging, and respiration-related measures. The promise is simple: your body’s recovery state often predicts how well you’ll concentrate, learn, and make decisions.
But the signals can also be confusing. HRV can rise or fall for reasons unrelated to stress. RHR can drift from hydration, illness, or caffeine timing. Sleep metrics can look “good” while your respiration patterns suggest fragmented recovery. Your job is not to chase a single number. Your job is to understand what each metric tends to reflect, how long it takes to form a baseline, and what actions make sense when trends shift.
This guide shows you how to interpret wearable focus metrics using HRV, RHR, sleep, and respiration. You’ll also get practical steps to build baselines and respond appropriately—without treating the data like a diagnosis.
First, understand the signals behind wearable focus estimates
Most wearable “focus” scores are derived from a combination of:
- HRV (often measured during sleep or rest)
- RHR (typically measured overnight or over a resting period)
- Sleep quality (duration, efficiency, and sometimes sleep stages)
- Respiration-related metrics (breathing rate patterns, respiration variability, or inferred sleep-disordered breathing signals)
Even when the wearable doesn’t disclose the exact formula, the direction usually follows physiology. When your nervous system recovers well overnight, HRV often improves and RHR trends down. When sleep is fragmented or your breathing pattern suggests reduced recovery, HRV may drop and RHR may rise.
Still, wearables vary. Two devices can show different HRV values for the same night because of sensor placement, algorithms, filtering, and how they sample data. That means your most reliable comparisons are within your own history, not across devices.
HRV: the recovery and autonomic balance indicator
What HRV actually reflects
Heart rate variability is the variation in time between heartbeats. It’s commonly expressed as RMSSD (root mean square of successive differences) in milliseconds (ms) for wearable use cases. Higher HRV often corresponds to greater parasympathetic (recovery-oriented) influence and a “more adaptable” autonomic nervous system. Lower HRV often corresponds to higher stress load, fatigue, poor sleep, illness, or high training intensity.
Important nuance: HRV is not a moral score and it’s not purely “good” or “bad.” For athletes, some training blocks can produce lower HRV while performance is still progressing. For everyone, HRV can shift quickly after caffeine, alcohol, dehydration, and even a late heavy meal.
How to interpret HRV trends without overreacting
Use a baseline approach:
- Pick a timeframe: at least 14 days, ideally 30 days, of consistent data.
- Track direction: focus on whether HRV is trending below or above your typical range.
- Use “relative change”: a 10–20% drop from your baseline may matter more than the absolute number.
Many people make the mistake of reacting to a single night. A single low HRV reading can happen due to travel, a stressful meeting, or a poor sleep environment. Instead, look for patterns lasting 48–72 hours or repeated dips over several nights.
Practical HRV scenarios you can recognize
Scenario A: You had late caffeine. You drink coffee at 3:30 PM, then sleep at 11:30 PM. Your HRV is 15% below baseline for the next two mornings. Your RHR may be slightly elevated. What’s likely happening is increased sympathetic tone and reduced sleep depth. The action isn’t “panic.” It’s adjusting caffeine timing and protecting bedtime for the next two nights, then reassessing trends.
Scenario B: You’re fighting something off. You feel “off” for a day, with mild sore throat. HRV drops and stays low for several days. RHR may remain elevated even if you think you slept fine. This pattern often aligns with early illness or immune activation. In that case, prioritize rest, hydration, and lower training intensity rather than forcing high-focus work.
RHR: a simple marker of strain, recovery, and baseline physiology
What resting heart rate measures
Resting heart rate is your heart’s beats per minute (bpm) at rest. Wearables often estimate RHR from overnight data or periods when you’re inactive. When RHR trends upward over days, it can reflect increased stress, incomplete recovery, dehydration, poor sleep, illness, or heavy training load.
RHR is less “sensitive” than HRV for some people, but it’s often easier to interpret as a broader recovery signal. It can also be influenced by temperature, altitude, and medication.
How to set your RHR baseline
To interpret RHR, avoid day-to-day noise:
- Baseline length: 2–4 weeks of data is a good start.
- Consistency matters: compare mornings under similar routines (same general bedtime window, similar wake time).
- Look for sustained changes: a rise that persists for 3+ mornings is more meaningful than a single spike.
As a practical rule, if your RHR is consistently above your usual range and your HRV is below baseline, treat it as a recovery red flag. If both metrics move in opposite directions, you’ll need to consider context (sleep quality, alcohol, travel, illness, or high training volume).
Real-world example: a high-workload week
Imagine you’re in a tight project cycle. You’re working late, skipping workouts one day but doing a hard session the next. Your wearable shows HRV down 20% compared to baseline, while RHR is up by 3–5 bpm for three mornings. Sleep duration might still be “okay,” but you notice your awakenings increased and your respiration patterns look less stable.
In this situation, the data suggests your stress load is exceeding your recovery. Instead of adding more willpower, you can adjust: schedule one lighter day of training, stop work tasks 60–90 minutes earlier for two nights, and ensure your sleep environment is consistent (cooler room temperature, less light, fewer late notifications). Then check whether HRV rebounds and RHR returns toward baseline over the next 3–5 days.
Sleep metrics: duration, efficiency, and why stage estimates still matter
What sleep metrics tell you
Wearables typically report:
- Total sleep time (hours)
- Sleep efficiency (percentage of time in bed spent asleep)
- Sleep stages (light, deep, REM—estimated rather than directly measured)
- Wake after sleep onset (fragmentation indicator)
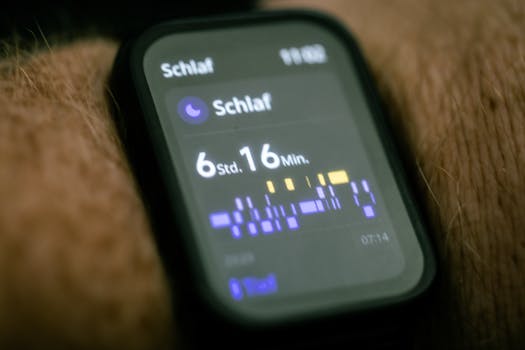
Even though stage scoring is estimated, trends can be useful. For example, if deep sleep time drops repeatedly during a stressful period, you may feel less refreshed even if total sleep duration stays constant.
How to interpret sleep quality alongside HRV and RHR
Sleep quality often provides the “why” behind HRV and RHR changes. A useful interpretation model is:
- Sleep duration is short → HRV often drops; RHR may rise.
- Sleep fragmentation increases → HRV may drop more than expected; you might see more awakenings and lower efficiency.
- Stage balance shifts (less deep or REM) → HRV can reflect less recovery even if you slept “enough.”
Don’t treat one metric alone. If your wearable reports 7.5 hours of sleep but efficiency is 80% and you had multiple awakenings, your nervous system may not have gotten the recovery it needs.
A practical sleep experiment you can run in 7–10 days
Pick one controllable variable and test it:
- Choose a fixed wake time within a 30-minute window.
- Keep caffeine cutoff at least 8 hours before bedtime (many people need 10 hours).
- Dim lights and reduce screens in the last 45–60 minutes before bed.
Track HRV, RHR, and sleep efficiency for 7–10 days. If your HRV rises and your RHR declines while sleep efficiency improves, you’ve identified a leverage point for your focus readiness.
Respiration metrics: breathing patterns as a recovery and sleep quality signal
Why respiration relates to focus
Your breathing pattern influences oxygenation, carbon dioxide balance, and sleep stability. Some wearables estimate respiration rate trends and variability. Others flag possible sleep-disordered breathing patterns using indirect signals during sleep.
When respiration-related metrics suggest instability—such as more irregular breathing patterns, elevated respiration rate during sleep, or repeated “events”—sleep may become less restorative even if total sleep time looks normal. That can show up as reduced HRV and higher RHR the next morning.
How to interpret respiration signals responsibly
Respiration metrics are helpful but not definitive. A wearable cannot confirm a medical diagnosis. Treat respiration-related changes as a cue to pay attention to symptoms and consider professional evaluation if needed.
Look for consistent patterns:
- Persistent elevated respiration rate across multiple nights
- Frequent irregular breathing indicators during sleep
- Daytime consequences such as morning headaches, loud snoring you notice from a partner, or unusual daytime sleepiness
If you have these symptoms, it’s reasonable to discuss them with a clinician. The goal is not to interpret a wearable as a diagnosis—it’s to use it as a signal that your sleep quality may be limited by breathing-related factors.
Scenario: you “sleep enough” but feel unproductive
You get 7–8 hours in bed. Your focus score seems inconsistent. HRV is often lower than baseline, and your sleep efficiency is mediocre. Respiration metrics show repeated instability during the first half of the night.
In this scenario, the most productive next step is not to grind harder. It’s to investigate sleep quality drivers: alcohol timing, late meals, nasal congestion, and breathing comfort. For example, if you drink alcohol within 4–6 hours of bedtime, it can worsen breathing stability. If you’re congested, treating allergies or improving nasal airflow may help. If symptoms persist, a sleep evaluation may be appropriate.
Building a personal baseline for focus readiness
Why baselines beat one-off readings
Wearable metrics are personal. A “normal” HRV for you might look low on someone else’s profile. Your RHR can shift with fitness level, age, stress exposure, and even typical walking pace.
A baseline approach reduces false alarms and helps you understand what “good” looks like for your physiology.
What to track and for how long
For a workable baseline, track:
- HRV: 14–30 mornings (overnight HRV is usually most consistent)
- RHR: same period, using morning values
- Sleep efficiency and awakenings: daily
- Respiration trends: weekly pattern review
If you want a practical timeframe, aim for 21 days before you make major interpretations. That’s long enough to capture normal variability while still being manageable.
How to turn trends into decisions for your day
Instead of asking, “What is my focus score today?” ask, “What is my recovery state?” Then match your work intensity to that state.
Example decision logic:
- HRV above baseline + RHR stable/down + sleep efficiency improving: schedule deep work blocks (60–120 minutes) and harder cognitive tasks.
- HRV below baseline + RHR up + fragmented sleep: prioritize planning, administrative work, and lighter cognitive tasks. Keep meetings shorter. Use breaks deliberately.
- Respiration instability recurring: protect sleep timing, reduce late alcohol, and address congestion. If symptoms are strong, seek medical advice.
This approach helps you use wearable metrics as a planning tool rather than a source of anxiety.
Using wearable focus metrics in a real productivity routine
A realistic morning workflow (5–8 minutes)
You can incorporate these metrics without turning your day into a data review:
- Check one HRV trend (yesterday vs. your typical range).
- Check one RHR trend (morning value vs. your 7-day average).
- Scan sleep efficiency and awakenings from last night.
- Review respiration-related notes only if they’ve changed or if you’ve had symptoms.
Then decide your work allocation for the first half of the day. If your recovery state looks strong, you’ll likely benefit from uninterrupted focus. If it looks strained, you’ll reduce the risk of mental fatigue by adjusting task difficulty and pacing.
Example week: adjusting training and work intensity
Suppose you’re training for a 10K while also running a demanding knowledge-work schedule. On Monday and Tuesday, your wearable shows HRV trending down 15–25% and RHR up 3 bpm. Sleep efficiency drops, and respiration metrics show more instability.
You respond with a deliberate plan:
- Training: swap one hard workout for an easy 30–40 minute session.
- Work: schedule deep work on Wednesday afternoon instead of Monday morning.
- Sleep: keep bedtime within a 30-minute window and reduce alcohol to zero for the next 3 nights.
- Recovery: add a 10–20 minute walk after lunch to reduce afternoon stress and support sleep pressure.
By Thursday, HRV begins to rebound and RHR stabilizes. Your focus becomes more consistent. This isn’t magic. It’s alignment between workload and recovery.
Common pitfalls: what to avoid when interpreting wearable metrics

Don’t treat HRV as a daily “score”
HRV is sensitive to many variables: hydration, illness onset, travel, menstrual cycle phases, and even a rough mental day. If you try to interpret every daily fluctuation, you’ll confuse noise with signal.
Don’t ignore context for RHR
RHR can rise due to room temperature, stress, late meals, and certain medications. If you had a fever, RHR changes are expected. If you slept in a warm room, RHR might be higher regardless of your stress mindset.
Don’t overtrust sleep stage estimates
Sleep stage numbers are useful as trends, not as exact measurements. A wearable’s deep/REM percentages can differ from lab results. Treat stage shifts as “directional clues,” then confirm with how you feel and how your metrics trend over time.
Don’t assume respiration metrics are definitive
Respiration-related signals can be impacted by fit, movement, and sensor quality. If you suspect sleep apnea or have strong symptoms, use wearable data to inform a conversation with a clinician, not to self-diagnose.
Practical guidance for improving recovery and focus
Adjust the levers that usually move these metrics
Across many people, these interventions often improve HRV, stabilize RHR, and improve sleep efficiency:
- Consistent wake time: helps anchor circadian rhythm.
- Caffeine cutoff: many do better with cutoff 8–10 hours before bed.
- Alcohol reduction: even 1–2 drinks can disrupt sleep quality for some people.
- Evening light management: reduce bright light exposure near bedtime.
- Training load pacing: avoid stacking hard sessions without recovery days.
- Hydration and meal timing: dehydration and late heavy meals can affect both sleep and heart signals.
Use a “trend response” window instead of constant tweaking
When you change one variable—like bedtime, caffeine, or workout intensity—give it 3–5 days to show up in HRV and RHR trends. Sleep metrics can change within a night, but autonomic adaptation often takes several days.
This prevents the common cycle of overcorrecting based on a single data point.
When to treat wearable signals as a health prompt
Most wearable data is meant for wellness and trend monitoring. However, there are times when you should treat unusual patterns as a reason to seek professional input—especially if respiration-related metrics correlate with symptoms.
Consider contacting a clinician if you repeatedly observe:
- Persistent low HRV with rising RHR over multiple weeks
- Unexplained fatigue or reduced exercise tolerance
- Breathing-related symptoms such as loud snoring, witnessed pauses in breathing, morning headaches, or excessive daytime sleepiness
Wearable metrics can be a useful starting point for those conversations because they provide a time-based record rather than a single moment of concern.
Summary: turn HRV, RHR, sleep, and respiration into a calmer focus system
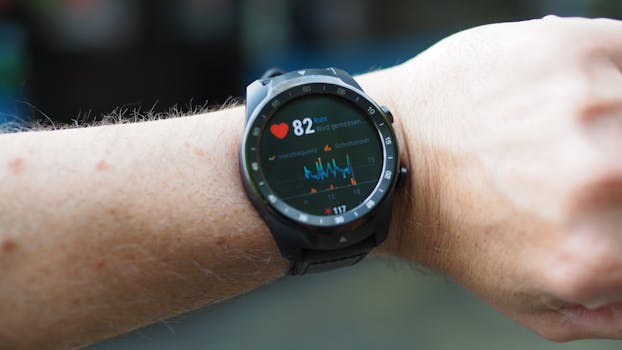
Wearable focus metrics become truly useful when you understand what each component tends to represent:
- HRV reflects autonomic recovery and adaptability—best interpreted as a trend over 2–4 weeks.
- RHR provides a broader marker of strain and recovery—look for sustained changes across several mornings.
- Sleep metrics explain the “why” behind shifts in HRV and RHR, especially sleep efficiency and fragmentation.
- Respiration metrics can reveal breathing-related sleep disruption; treat them as a signal to investigate, not to self-diagnose.
If you use these signals to plan your day—more deep work when recovery looks strong, lighter cognitive load when it doesn’t—you’ll likely feel less frustrated by inconsistent focus. And if respiration-related patterns line up with symptoms, you’ll be better positioned to seek appropriate care.
The core prevention principle is simple: don’t chase a single number. Build baselines, respond to trends, and protect the routines that support recovery.
23.02.2026. 21:33