Weekly Wearable Dashboard: CGM, HRV, and Resting Heart Rate
Set a weekly wearable dashboard to track CGM, HRV, and resting heart rate
A weekly wearable dashboard helps you see patterns instead of isolated readings. The goal is simple: compile your CGM metrics, HRV, and resting heart rate into one consistent weekly view so you can spot changes in sleep, recovery, and metabolic responses. When these signals are organized the same way every week, you can make faster, more reliable adjustments to training load, nutrition timing, and lifestyle habits.
This guide walks you through building that routine using the apps and dashboards that come with most wearables and CGM systems, plus a repeatable weekly check-in workflow.
Preparation and setup you need before starting
Before you begin, make sure your data sources are stable and you know where each metric appears in your apps. You do not need special hardware, but you do need consistent data capture.
- A compatible wearable that reports HRV and resting heart rate (commonly via an app that supports weekly summaries or export).
- A CGM system that provides daily/weekly summaries (time in range, average glucose, variability, and trend graphs).
- Primary apps accounts for your wearable and CGM. Use the same login each time.
- One place to view the dashboard: the wearable app’s built-in dashboard, a health platform that aggregates data, or a spreadsheet/workspace you update weekly.
- Optional but helpful: a notes app or journal for weekly observations, and a cloud storage folder to keep exports.
- Time window definition: choose a weekly cycle (for example, Monday 00:00 to Sunday 23:59) and stick with it.
Step-by-step: build your weekly wearable dashboard
-
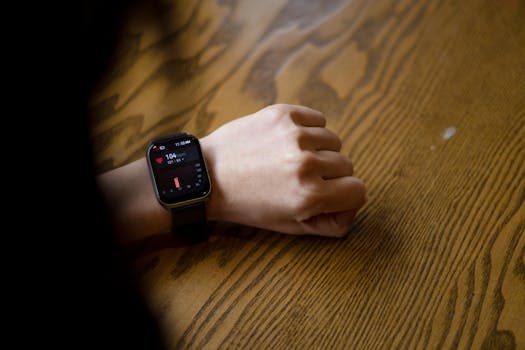
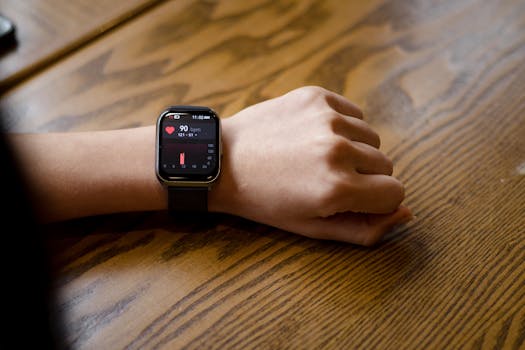
Confirm HRV and resting heart rate are being captured reliably.
Open your wearable app and check that HRV and resting heart rate show recent values with timestamps. If you see gaps, fix the cause first (sensor fit, skin irritation, or device syncing issues) before building the dashboard.
-
Identify the exact CGM metrics you will track each week.
In your CGM app, select a small set of weekly metrics that represent your metabolic picture. Common choices include average glucose, time in range (your target band), time above/below range, and glucose variability. Keep the selection stable week to week so your trends remain comparable.
-
Turn on the right data permissions and syncing.
In your phone settings and health permissions, enable data sharing for both your wearable and CGM apps. If your platform supports it, allow background data updates so your weekly summary is complete.
-
Choose your dashboard location (built-in or aggregated).
If your wearable app already has weekly views, use it as the base. If you use an aggregator (a health platform that merges wearable and CGM), confirm that HRV, resting heart rate, and CGM summaries appear in the same weekly timeframe.
-
Set your weekly reporting window in each app or dashboard.
Many apps let you switch between daily, weekly, and monthly views. Select the weekly view and ensure it aligns with your defined week. If the app uses a different week boundary, record the mismatch in your notes so you interpret trends correctly.
-
Create a weekly “snapshot” template so each check-in is consistent.
Use a notes template or a spreadsheet with the same fields every week. Include:
- HRV: weekly average (or median) and the lowest/highest day
- Resting heart rate: weekly average and the highest day
- CGM: weekly average glucose, time in range, time above/below target, and variability
- Context: notable sleep changes, illness, travel, heavy training, or major diet shifts
This consistency is what turns raw biometrics into actionable pattern recognition.
-
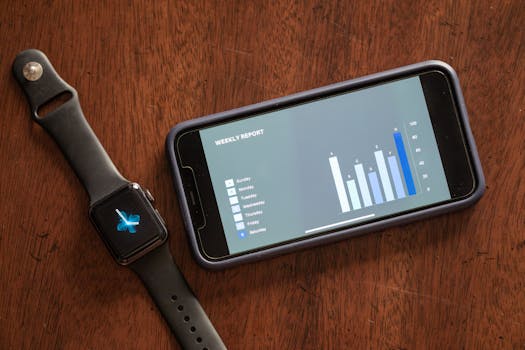
Export or capture your weekly data at the same time each week.
Pick a routine moment (for example, Sunday evening) and pull the latest weekly values from your wearable and CGM apps. If your apps support export (CSV, PDF, or screenshot), keep them in a dedicated folder named by week (e.g., “2026-W21”).
-
Verify data completeness before interpreting trends.
Check for missing days in HRV or resting heart rate. For CGM, confirm you have enough wear time to trust weekly summaries. If you see an unusually low data capture rate, note it and avoid overreacting to the week’s numbers.
-
Review patterns using recovery logic, not single-day judgment.
Look for the relationship between recovery and metabolic signals. For example, if HRV trends down while resting heart rate trends up, consider whether sleep quality, stress, or training load increased. If CGM time in range drops, review meal timing, carbohydrate distribution, and any changes in activity.
-
Log one or two actions you will test next week.
Choose changes you can actually measure. Examples: shift dinner earlier by 60–90 minutes, keep evening caffeine earlier, reduce late high-intensity sessions, or maintain a consistent bedtime. Your dashboard should guide one controlled adjustment at a time.
Common mistakes that break weekly dashboard accuracy
- Using different weekly boundaries each time. If your apps roll over at different times, your weekly averages won’t be aligned. Fix by standardizing your check-in window or noting the boundary differences.
- Overweighting a single day. HRV and resting heart rate fluctuate due to stress, sleep disruption, alcohol, and illness. Weekly summaries reduce the noise—use them.
- Ignoring data capture gaps. If your wearable didn’t record HRV overnight or your CGM had sensor downtime, weekly averages can look worse or better than reality.
- Changing targets midstream. If your CGM target range changes, time-in-range metrics lose continuity. Keep targets consistent unless you intentionally adjust them for a planned reason.
- Collecting too many metrics. A dashboard that tracks everything becomes unusable. Stick to a small set of weekly indicators you can interpret in under five minutes.
- Not logging context. Without notes about travel, illness, or training changes, you may misattribute trends. Add context even if it’s brief.
Additional practical tips to optimize your weekly dashboard
Make your dashboard “decision-ready”
After you build the snapshot template, aim for a workflow that takes about 5–10 minutes per week. The dashboard should answer three questions quickly:
- Did recovery improve or worsen compared with the prior week?
- Did glucose control improve or worsen based on time in range and variability?
- What is the most likely context driver (sleep, stress, training, diet timing)?
Use consistent measurement conditions
HRV and resting heart rate are sensitive to sleep quality and timing. Try to keep these variables stable when you test an intervention:
- Maintain a consistent bedtime and wake time when possible.
- Keep late caffeine and alcohol patterns consistent for at least one full week.
- If you change training, document the intensity and timing so you can interpret HRV shifts.
Pair CGM interpretation with meal timing
Weekly CGM metrics summarize the week, but the “why” often comes from meal timing. If your time-in-range worsens, review whether the biggest carbohydrate meals moved later in the day or whether snacking increased. If you see larger variability, check for inconsistent meal sizes and fewer structured meals.
Consider using an aggregator to reduce friction
If your wearable and CGM apps are separate and you find it hard to compare weekly views, a health data aggregator can help consolidate reporting. The key is still the same: confirm that HRV, resting heart rate, and CGM weekly summaries are present and correctly time-aligned.
When you do use an aggregator, double-check that it uses the same local timezone as your wearable and CGM. A timezone mismatch can shift daily boundaries and subtly distort weekly averages.
Keep a simple “trend rule” for action
To avoid reacting to normal fluctuations, set a threshold for when you adjust behavior. For example:
- If resting heart rate rises and HRV drops for two consecutive weeks, treat it as a recovery warning and reduce training stress or improve sleep consistency.
- If time in range drops for two consecutive weeks, review meal timing, portion consistency, and activity after meals.
This approach keeps your dashboard from turning into constant tinkering.
Store weekly exports for longitudinal review
Even if you rely on app dashboards, keep a record of each week’s snapshot. Over months, you can identify patterns that a single weekly view can’t reveal. Create a folder structure like “CGM + Wearable” and save weekly exports with a clear naming convention.
If your platform allows data export, use it. If it doesn’t, keep screenshots of the weekly summary pages and your notes template so you can reconstruct trends later.
Watch for sensor-related artifacts
HRV and resting heart rate can be affected by sensor fit and skin conditions. If you notice abrupt changes that don’t match your sleep or lifestyle context, check:
- Whether the wearable was worn during the relevant nights
- Whether the sensor was repositioned or loosened
- Whether there was a syncing delay that caused missing or delayed HRV data
Weekly check-in routine you can repeat every week
Once your dashboard is set up, the routine becomes the optimization. Use this repeatable flow:
- Open the weekly view for your wearable and confirm HRV and resting heart rate are complete for the week.
- Open the weekly CGM view and confirm you have adequate sensor wear time and the key metrics are populated.
- Update your snapshot template with the weekly averages and extremes (highest resting heart rate day, lowest HRV day, and key CGM time-in-range values).
- Write one line of context: sleep changes, training load, stressors, travel, or diet timing shifts.
- Choose one small, measurable action for the following week and keep everything else as stable as possible.
With this structure, your weekly wearable dashboard becomes a reliable monitoring system rather than a collection of disconnected graphs.
19.02.2026. 18:59