Metabolic Health Metrics on Wearables: How to Interpret Them
Why metabolic health metrics on wearables need context
Wearables have made it easier than ever to track daily physiology—heart rate trends, sleep stages, activity patterns, and recovery indicators. Many people now look for “metabolic health” signals in these devices, hoping to spot early changes in insulin sensitivity, cardiovascular risk, or energy balance. The challenge is that wearable data is often indirect. Even when a metric correlates with metabolic status, it may reflect multiple underlying processes such as stress, fitness level, hydration, temperature, sleep quality, and measurement quality.
This guide explains the most common metabolic health metrics seen on wearables, how they’re typically derived, what they can and cannot tell you, and how to interpret them responsibly. The goal is not to treat a wrist or finger sensor as a clinical laboratory, but to help you use trends intelligently—especially when you’re trying to improve metabolic health over time.
What “metabolic health” means in wearable terms
In clinical settings, metabolic health usually relates to insulin action, glucose regulation, lipid metabolism, blood pressure regulation, inflammation, and body composition. Wearables don’t measure these directly in most cases. Instead, they estimate or infer related processes through measurable signals:
- Cardiovascular autonomic balance (often via heart rate variability)
- Resting and recovery physiology (resting heart rate, recovery heart rate)
- Sleep quality (duration and timing, sometimes sleep stages)
- Physical activity patterns (steps, active minutes, intensity)
- Thermoregulation and stress response (skin temperature, resting HR shifts)
Some wearables also provide glucose-related estimates, but accuracy varies widely by device, algorithm, and individual physiology. Even with glucose estimates, the interpretation must consider confounders such as recent meals, exercise timing, and sensor placement.
Glucose and glucose estimates: what wearables can measure indirectly
When people search for metabolic health metrics on wearables, they often start with glucose. A few devices use technologies such as optical sensing, biosensors, or algorithmic estimates. However, most consumer wearables do not provide laboratory-caliber blood glucose readings. If your wearable provides a glucose estimate, it’s usually a proxy derived from heart rate, skin signals, and algorithmic modeling rather than a direct measure of blood glucose concentration.
Common wearable glucose-related metrics
- Estimated glucose level: a modeled value, not a lab measurement.
- Estimated glucose rise and fall: often inferred from changes in heart rate and other signals after meals.
- Time in range (if provided): typically based on the device’s estimated values.
- Glucose “spikes” or variability: algorithmic detection of patterns consistent with post-meal changes.
How to interpret glucose estimates without overreacting
Glucose-related estimates can be useful for identifying patterns—such as consistent post-meal elevations or differences between days—but they should be interpreted as trends, not as absolute truth. A practical approach:
- Look for repeated patterns across multiple days rather than reacting to a single reading.
- Use consistent meal timing and similar carbohydrate loads when comparing days.
- Account for exercise: activity can lower and reshape glucose response; late-night workouts can also change sleep physiology, indirectly affecting estimates.
- Consider measurement conditions: tightness of the sensor, skin temperature, and motion artifacts can change signal quality.
For clinical decision-making—diagnosis, medication changes, or evaluation of symptoms—wearables should not replace validated blood glucose testing or continuous glucose monitoring (CGM) performed under medical guidance.
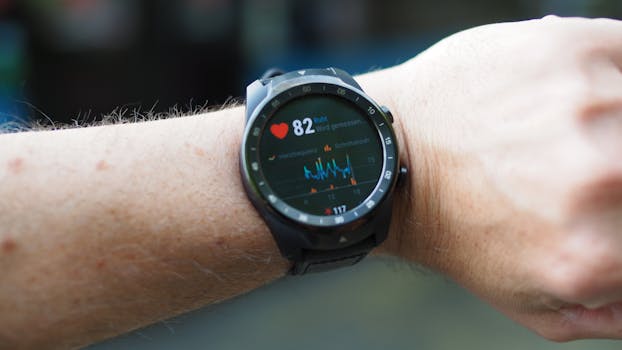
Heart rate variability (HRV): an autonomic window into metabolic stress
Heart rate variability (HRV) is one of the most widely used metrics to reflect autonomic nervous system balance. In metabolic health discussions, HRV matters because insulin sensitivity, inflammation, and cardiovascular risk are influenced by stress physiology. When the body is under chronic stress—physical, psychological, or sleep-related—HRV often shifts toward lower variability.
What HRV typically represents
HRV is calculated from the time variation between heartbeats (often using wearable optical sensors or ECG-capable devices). Many platforms present HRV as a daily average or a morning value. The most common HRV measures are time-domain or frequency-domain metrics; consumer outputs usually provide a processed “score” or an index.
How HRV links to metabolic outcomes
- Stress and recovery: Lower HRV can reflect impaired recovery, which often coexists with worse glucose regulation.
- Sleep quality: Poor sleep can reduce HRV and also worsen next-day glucose control.
- Inflammation and cardiovascular strain: Chronic low-grade stress can show up in both HRV and metabolic markers.
Practical guidance for using HRV trends
- Track baseline and variability: HRV naturally changes with fitness, age, alcohol intake, illness, and training load.
- Prefer trend interpretation: A single low day is less informative than a sustained change over 2–4 weeks.
- Control confounders: If you want to see whether lifestyle changes improve HRV, keep sleep schedule and training intensity relatively consistent.
- Check for illness: HRV often drops during infections and recovery periods; a “metabolic” conclusion may be premature.
If your wearable uses a “readiness” or “recovery” score that incorporates HRV, you can still use HRV as the underlying signal—just remember that the composite score may be influenced by multiple factors, not only metabolic status.
Resting heart rate and recovery heart rate: signals of energy regulation
Resting heart rate (RHR) is commonly used as a broad marker of cardiovascular and autonomic status. In many people, sustained changes in RHR can reflect shifts in fitness, stress, sleep, hydration, and metabolic strain. Recovery heart rate—how quickly heart rate drops after exercise—can also indicate cardiovascular fitness and autonomic recovery.
Resting heart rate as a metabolic-adjacent metric
When metabolic health worsens (for example, due to insulin resistance, increased inflammation, or excess body fat), cardiovascular strain and autonomic imbalance may follow. Wearables can show these changes indirectly through RHR trends. However, RHR can also rise from heat exposure, dehydration, poor sleep, alcohol, and overtraining.
How to interpret RHR changes responsibly
- Use a multi-week baseline: One higher day is usually not meaningful.
- Pair RHR with sleep: If RHR rises on days with short or fragmented sleep, the cause may be recovery rather than metabolism.
- Consider training load: Hard training can elevate RHR for days; metabolic improvements may be masked temporarily.
- Watch for persistent direction: A consistent upward drift over several weeks can justify checking other factors and discussing with a clinician if you have risk factors.
Recovery heart rate and post-exercise physiology
Recovery heart rate is often computed from heart rate measurements after a standardized exercise test or during a routine activity. A faster recovery can indicate better autonomic function and cardiovascular fitness. Because autonomic recovery ties into stress physiology, recovery heart rate can be a useful “metabolic-adjacent” signal—especially when combined with sleep and HRV.
Sleep metrics: the most actionable wearable lever for metabolic health
Among wearable-derived signals, sleep is frequently the strongest and most modifiable link to metabolic regulation. Poor sleep can worsen insulin sensitivity, increase appetite signaling, and impair autonomic balance. Even when a wearable doesn’t directly measure glucose, it can capture sleep duration, timing, regularity, and quality indicators that correlate with metabolic outcomes.
Key sleep metrics you’ll see on wearables
- Total sleep time
- Sleep efficiency (time asleep vs time in bed)
- Sleep latency (time to fall asleep)
- Wake after sleep onset (fragmentation)
- Sleep timing regularity (consistent bed/wake times)
- Sleep stages (light, deep, REM—varies by device accuracy)
How to use sleep data to infer metabolic risk
Rather than fixating on a single “best” sleep stage, focus on patterns:
- Consistency beats perfection: Regular sleep timing often improves metabolic physiology more reliably than chasing one-night gains.
- Fragmentation matters: Frequent awakenings can correlate with worse next-day glucose control.
- Short sleep is a red flag: Repeatedly short sleep can raise appetite and reduce insulin sensitivity.
If your wearable provides a respiratory or sleep apnea risk estimate (some platforms do), treat it as a prompt to seek clinical evaluation rather than a diagnosis. Sleep-disordered breathing has a strong relationship with metabolic health and cardiovascular risk.
Activity and energy expenditure: interpreting movement as a metabolic signal
Wearables provide multiple ways to track activity: steps, active minutes, intensity estimates, and sometimes even “metabolic equivalent” style outputs. Movement influences glucose regulation directly by increasing muscle glucose uptake and improving insulin sensitivity over time.
Useful activity metrics for metabolic health
- Post-meal walking or light activity: many people see improved glucose response when they move soon after eating.
- Daily step count: useful for tracking consistency, though it’s not a direct metabolic measure.
- Minutes in moderate-to-vigorous activity: reflects cardiorespiratory stimulus.
- Intensity distribution: some platforms estimate “training load” or intensity balance.
- Sedentary time and breaks: prolonged sitting can worsen postprandial glucose response.
How to turn activity data into practical guidance
- Target regularity: Metabolic improvements often track with “repeatable” activity habits rather than sporadic high-intensity efforts.
- Consider timing: If your wearable shows glucose variability or you notice energy crashes, experiment with adding light movement after meals.
- Balance training and recovery: Overreaching can raise RHR and reduce HRV, offsetting some benefits.
Many wearables also report “active calories” or energy expenditure. These can be helpful for awareness, but they’re frequently less accurate than heart rate-based estimates for individual physiology. Use them as directional signals, not as exact calorie accounting.
Skin temperature, stress indicators, and inflammation-adjacent signals
Some wearables track skin temperature trends and provide “stress” or “strain” metrics derived from heart rate patterns and variability. While these aren’t direct inflammation or metabolic markers, they can reflect physiological stress that influences glucose regulation and appetite.
Skin temperature: what it can suggest
Skin temperature can change with ambient conditions, peripheral blood flow, and recovery state. In many people, a stable temperature pattern and appropriate recovery correlate with better sleep and autonomic balance. If skin temperature repeatedly rises alongside higher RHR and lower HRV, it may indicate stress, inadequate recovery, or illness—factors that also affect metabolic health.
Wearable stress scores: interpret as “system load”
Stress algorithms typically combine heart rate, HRV, respiration proxies (in some devices), and movement. A stress score is best treated as a signal of overall system load. If your metabolic metrics (such as glucose estimates or time-in-range) worsen on days with high stress scores, that relationship may reveal something actionable: recovery and sleep consistency may be the lever.
Body composition and weight trends: when metrics align and when they mislead
Many wearables now estimate body composition using bioelectrical impedance (BIA) scales or in-device algorithms. These estimates can support metabolic health monitoring when used correctly, but they can also mislead due to hydration status and measurement timing.
What to watch for
- Trends in weight: useful for identifying overall direction, but weight alone doesn’t distinguish fat vs water.
- Estimated body fat percentage: often sensitive to hydration and timing.
- Waist measurements (if you track them manually): can correlate more directly with visceral fat risk.
How to interpret body composition data alongside metabolic signals
If body fat estimates improve while HRV increases and sleep improves, that combination strengthens the case that metabolic health may be moving in a favorable direction. If weight changes but sleep and HRV worsen, the weight trend might be driven by water shifts or temporary factors. For metabolic interpretation, prioritize consistent lifestyle signals—sleep regularity, activity timing, and recovery indicators—over day-to-day body composition fluctuations.
Common pitfalls when interpreting wearable metabolic metrics
Misinterpretation is common because wearable algorithms are designed for usability, not clinical diagnosis. Here are frequent pitfalls:
- Overreacting to single-day changes: most wearable signals fluctuate for reasons unrelated to metabolism.
- Ignoring confounders: alcohol, illness, travel, heat, menstrual cycle changes, new medications, and even device fit can shift metrics.
- Comparing across devices: different sensors and algorithms produce different baselines.
- Assuming “normal” means “healthy”: some people with metabolic risk may show subtle wearable changes that aren’t obvious without trend analysis.
- Chasing one metric: metabolic health is multi-system. HRV, sleep, activity timing, and glucose estimates (if available) should be interpreted together.
A practical way to build an “evidence-based” wearable routine
If you want to use wearables to monitor metabolic health, the most effective strategy is to create a consistent monitoring routine and interpret changes through the lens of patterns. Here’s a practical framework you can apply regardless of brand.
1) Establish baselines
Use at least 2–4 weeks to understand your typical range for:
- Morning HRV or nightly HRV trend
- Resting heart rate trend
- Sleep duration and fragmentation
- Activity consistency (steps or active minutes)
If your device provides glucose estimates, add them to the baseline with caution—your goal is to understand your day-to-day variability, not to treat the numbers as absolute.
2) Change one variable at a time
Metabolic physiology responds to many factors. If you change diet, exercise timing, and sleep schedule all at once, it becomes hard to know what helped. Consider:
- Prioritizing sleep regularity first
- Adding post-meal light movement
- Maintaining consistent training intensity
3) Use “triangulation” across metrics
A change is more credible when multiple signals move together. For example:
- Sleep improves → HRV increases and RHR decreases
- Post-meal movement increases → glucose estimates become less variable
- Recovery improves → stress scores drop and readiness indicators stabilize
When only one metric changes, consider measurement noise and confounders.
4) Keep a simple log for context
Wearable data becomes much more interpretable when you add human context. A short daily note can capture:
- Alcohol intake
- Late meals
- Illness symptoms
- Travel or schedule disruptions
- Hard workouts
This helps you avoid “metabolic” conclusions that are actually stress, dehydration, or poor sleep.
When to involve clinical testing
Wearables are excellent for trend awareness, but metabolic health risk sometimes requires validated measurements. Consider clinical testing if you have symptoms (such as excessive thirst or frequent urination), known risk factors (family history of diabetes, cardiovascular disease, hypertension), or persistent concerning trends.
Validated options may include fasting glucose, HbA1c, oral glucose tolerance testing, lipid panels, blood pressure monitoring, and—when appropriate—continuous glucose monitoring under medical supervision. In particular, if your wearable glucose estimates show consistently concerning patterns, clinical confirmation is the responsible next step.
Summary: using wearable metrics to support metabolic health decisions
Metabolic health metrics on wearables can provide meaningful insight into how your body is functioning day to day—especially through HRV, resting heart rate trends, sleep quality, and activity timing. Glucose-related metrics, when available, are typically estimates and must be interpreted as patterns rather than exact values. The most reliable approach is to establish a baseline, look for multi-metric changes over weeks, and account for common confounders such as sleep fragmentation, illness, alcohol, and training load.
When wearable signals suggest persistent risk or you have clinical risk factors, the wearable data should guide awareness—not replace validated testing. Used thoughtfully, wearables can help you notice what’s changing in your metabolic physiology and which lifestyle levers (sleep regularity, recovery, and consistent movement) are most likely to move the needle.
FAQ: metabolic health metrics on wearables
How accurate are wearable glucose estimates?
For most consumer wearables, glucose estimates are indirect and algorithmic. They’re better suited for identifying patterns and day-to-day variability than for providing diagnostic-level accuracy. If you need clinical decisions, use validated blood glucose testing or CGM under medical guidance.
What HRV change usually means better metabolic health?
In general, improving HRV trends alongside better sleep and stable resting heart rate can reflect improved recovery and reduced physiological stress—conditions associated with better metabolic regulation. HRV should be interpreted over weeks and in context of illness, training load, and sleep.
Can resting heart rate predict insulin resistance?
RHR is not a direct measure of insulin resistance, but persistent upward trends can correlate with increased stress, poorer sleep, reduced fitness, or worsening metabolic status. Treat it as a signal to investigate lifestyle factors and, when appropriate, confirm with clinical tests.
What sleep metrics matter most for metabolic outcomes?
Sleep duration, sleep efficiency, and fragmentation (wake after sleep onset) are commonly relevant. Sleep regularity—consistent bed and wake times—often supports metabolic health more reliably than chasing a single sleep stage.
How should I compare metrics across different days?
Use trend comparisons rather than single-day judgments. Keep key conditions consistent when possible (sleep schedule, meal timing, exercise timing) and note confounders like alcohol, illness, and travel. A 2–4 week baseline is usually more informative than a few days.
Do activity metrics like steps directly improve metabolic health?
Regular activity supports metabolic health by improving glucose regulation and insulin sensitivity over time. Timing can matter too; light movement after meals may help reduce post-meal glucose variability in many people.
When should I stop relying on wearable trends and seek testing?
If you have symptoms, significant risk factors, or persistent concerning trends (especially around glucose-related estimates), clinical testing is appropriate. Wearables can inform awareness, but validated lab measures are needed for diagnosis and treatment decisions.
16.01.2026. 05:53