VO2max HRV Resting Heart Rate Interpretation: What It Means
Why VO2max, HRV, and resting heart rate need to be read together
VO2max, heart rate variability (HRV), and resting heart rate (RHR) are three common fitness and health biomarkers. Each one reflects a different side of physiology: VO2max relates to cardiorespiratory fitness and oxygen uptake capacity, HRV reflects autonomic nervous system regulation (balance between sympathetic and parasympathetic activity), and resting heart rate offers a practical window into overall cardiac load and recovery status.
When you interpret them separately, it’s easy to misread what’s happening—especially because training stress, sleep quality, illness, caffeine, hydration, and even normal life stress can all shift these signals. The most useful approach is to interpret them as a system and focus on trends over time rather than single-day values.
This article explains how to interpret VO2max HRV resting heart rate interpretation in a practical, educational way. You’ll learn what “good” and “concerning” patterns can look like, how to account for measurement differences, and how to use your data to make smarter adjustments to training and recovery.
What VO2max actually measures (and what it doesn’t)
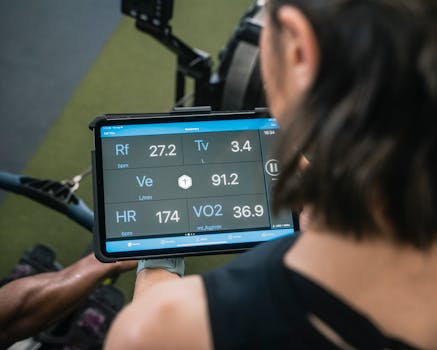
VO2max is the maximum rate at which your body can take up and use oxygen during intense exercise. In lab settings, it’s measured directly using breath-by-breath analysis. In consumer wearables and apps, VO2max is usually estimated from a combination of exercise data (heart rate response, pace, power, sometimes time-in-zone) and algorithms calibrated against lab tests.
Because estimates rely on assumptions, VO2max should be treated as a directional indicator rather than a perfect measurement. Still, VO2max trends can be meaningful:
- Improving VO2max often aligns with better aerobic conditioning, successful training blocks, and consistent endurance work.
- Plateaus can be normal when training is stable, when recovery is adequate but progression has slowed, or when measurement variability is high.
- Declines can reflect detraining, illness, under-recovery, major life stress, or algorithmic noise—especially if training volume or intensity changes abruptly.
Importantly, VO2max changes more slowly than HRV or RHR. HRV and RHR can shift within hours or days, while VO2max is typically influenced by longer-term adaptations.
HRV: the autonomic signal behind recovery and stress
Heart rate variability refers to the variation in time between heartbeats. It’s influenced by breathing, sleep stages, hydration status, stress hormones, and autonomic nervous system activity. Higher HRV is often associated with greater parasympathetic (rest-and-recover) influence, but the interpretation depends on the context and on the specific HRV metric your device reports.
Common HRV metrics and why they matter
Many wearables report either:
- RMSSD (root mean square of successive differences): commonly used for short-term HRV and often derived from beat-to-beat intervals.
- SDNN (standard deviation of normal-to-normal intervals): more influenced by longer recording windows.
- “HRV score”: a normalized index that may not map directly to clinical HRV metrics.
Because these metrics behave differently, you should interpret HRV based on your device’s definition and its historical baseline. If your wearable reports RMSSD, for example, you can still track day-to-day and week-to-week trends, but you shouldn’t assume the same thresholds apply to a different device or metric.
What HRV reductions can mean
Lower HRV compared with your personal baseline can occur when:
- You’re under-recovering from training (accumulated fatigue).
- You’re sleeping poorly or have fragmented sleep.
- You’re fighting an infection or experiencing systemic stress.
- You’ve had high mental stress, alcohol, or dehydration.
- You’ve trained intensely late in the day or done unusually hard sessions.
Conversely, HRV may increase when you’re well-rested, sleeping consistently, and your autonomic balance is shifting toward recovery.
Resting heart rate: a practical marker of load and recovery
RHR is your heart rate measured at rest, typically during sleep or upon waking, depending on the device. It’s influenced by aerobic fitness, hydration, temperature, stress, and even measurement technique. Like HRV, RHR is best interpreted as a trend.
Typical patterns
- Lower RHR over weeks often aligns with improved aerobic fitness and efficient cardiac function.
- Higher RHR over several days can signal accumulated fatigue, insufficient recovery, illness, or strong sympathetic activation (stress).
- Sudden spikes can be caused by poor sleep, alcohol, caffeine timing, dehydration, or a heavy training day.
RHR changes can be subtle or dramatic depending on your baseline and measurement consistency. If your device measures RHR during sleep, it may be more stable than if it measures immediately upon waking.
VO2max HRV resting heart rate interpretation: common scenarios
The most useful “interpretation” comes from combining the direction of changes across VO2max (longer-term), HRV (short-term autonomic status), and RHR (short-term cardiac load). Below are practical patterns you may see, along with likely explanations.
Scenario 1: VO2max trending up, HRV stable or improving, RHR stable or decreasing
This is often the most reassuring pattern. It suggests you’re adapting to training with adequate recovery. HRV stability or improvement implies autonomic balance is supporting recovery, while RHR stability or reduction suggests your baseline cardiac load is not being chronically elevated.
What to do: Continue your current training approach if performance and perceived recovery match the biomarker signals. Make gradual progression rather than frequent large swings in training load.
Scenario 2: VO2max plateau, HRV down, RHR up (for several days)
When HRV drops and RHR rises together, it often indicates increased physiological stress or incomplete recovery. Even if VO2max remains flat (which can be normal), the short-term signals can show that your body is not absorbing training as well as it could.
Common contributors include hard sessions clustered too closely, reduced sleep, high life stress, or early illness. This pattern doesn’t automatically mean you should stop training, but it is a strong cue to reduce load and prioritize recovery.
What to do: Consider an easier day, reduce intensity, and emphasize sleep. If HRV and RHR remain abnormal for more than a few days or you develop symptoms (sore throat, fever, unusual fatigue), consider resting and reassessing.
Scenario 3: VO2max downtrend, HRV consistently low, RHR elevated
A sustained decline in VO2max—paired with persistently low HRV and higher RHR—can reflect a longer period of under-recovery, illness, or detraining. Because VO2max estimates can be influenced by training patterns, it’s important to confirm that your training volume and intensity have not drastically changed in a way that makes the estimate less comparable.
What to do: Treat this as a recovery-first signal. Reduce training load, improve sleep consistency, and monitor for illness. If symptoms appear, prioritize medical evaluation rather than pushing through.
Scenario 4: HRV low but RHR normal (or only slightly changed)
This can happen when autonomic stress is present without a large increase in cardiac load. For example, mental stress, poor sleep quality, or dehydration can reduce HRV even if RHR doesn’t shift much. It can also reflect measurement differences—especially if your device’s HRV recording window varies from day to day.
What to do: Look at sleep quality, alcohol intake, hydration, and training timing. If HRV improves after adjusting those variables, the issue may be temporary rather than a sign of chronic overreaching.
Scenario 5: RHR high but HRV normal
RHR can be influenced by factors that don’t always strongly affect HRV, such as ambient temperature, caffeine, or a heavy day that raises baseline heart rate but doesn’t strongly suppress autonomic variability. Some people also see HRV fluctuate more than RHR, while others show the opposite.
What to do: Evaluate context. If you’ve had poor sleep, late caffeine, or you’re in a hot environment, those can elevate RHR. If both RHR and HRV later shift in tandem, then the combined pattern becomes more concerning.
Scenario 6: VO2max rising while HRV drops temporarily
This can occur during a training block where you’re pushing fitness gains but also accumulating short-term stress. VO2max estimates may increase as you perform more work and your heart rate response changes. Meanwhile, HRV can drop if recovery is not yet fully established.
What to do: Don’t overreact to a short dip in HRV if it resolves and performance remains stable. The key is whether the pattern persists across multiple days and whether you see additional warning signs like rising RHR or declining workout quality.
How to interpret changes: use personal baselines and time horizons
One of the biggest mistakes in biomarker interpretation is applying universal thresholds. HRV and RHR are highly individual. What counts as “high” or “low” depends on your baseline, age, sex, fitness level, medications, and even your typical breathing patterns during HRV measurement.
Choose the right time horizon
- HRV and RHR: look at 3–7 day trends, especially after changes in training, sleep, or stress.
- VO2max: evaluate over weeks to months, and interpret it alongside whether your training load and test conditions changed.
Look for consistent direction, not one-off days
A single low HRV reading after a late night or alcohol intake is less meaningful than several consecutive days of suppressed HRV without an obvious cause. Similarly, RHR can rise after a stressful workday or a long travel day.
Practical tip: Compare today to your recent average (for example, the last week) rather than to last night only. If your device provides a “baseline” or “relative” value, use that as a starting point, then confirm with symptoms and training response.
Measurement considerations that can change interpretation
Even the best biomarker framework can fail if the measurement context is inconsistent. Wearables vary in how they detect HRV and how they estimate VO2max. Understanding those limitations helps you interpret your data more accurately.
HRV measurement quality
- Sleep stage and time of night: HRV is often higher during relaxed periods and can vary by sleep stage.
- Movement and signal quality: poor sensor contact can reduce data reliability.
- Breathing effects: HRV is influenced by breathing patterns, which can vary with stress and sleep position.
If your wearable reports HRV only when it detects good signal quality, pay attention to whether the device marked the measurement as reliable.
RHR measurement context
- During sleep vs. upon waking: sleep-based RHR may be more consistent.
- Temperature and hydration: both can shift resting heart rate.
- Sensor fit: loose fit can increase noise.
VO2max estimation limitations
VO2max estimates can be affected by:
- Training type: if you switch from steady endurance to mostly interval training (or vice versa), the algorithm’s inputs change.
- Heart rate drift: dehydration or heat can raise heart rate at a given pace, affecting estimation.
- Device algorithm updates: some platforms adjust models over time.
To interpret VO2max meaningfully, look for changes that match your training and performance history, not just a number that updates after a single workout.
Practical guidance: what to do when the signals conflict
Biomarkers can sometimes disagree. A robust approach is to use them as a decision-support system rather than a strict rulebook.
Step 1: Check context first
Before concluding you’re “overreaching,” review common confounders from the last 24–48 hours:
- Sleep duration and consistency
- Illness symptoms (sore throat, congestion, feverish feeling)
- Alcohol intake
- Caffeine timing
- Travel or schedule disruption
- New medications or supplements (including decongestants)
- Heat exposure and hydration status
Step 2: Use the pattern, not the absolute values
Ask: Are HRV and RHR moving in the same direction? Is the change lasting multiple days? Does it align with how you feel during workouts?
- Concordant warning signs (HRV down + RHR up for several days) are more actionable than a single metric changing.
- Discordant signals may require more context review and a lighter adjustment rather than a major training change.
Step 3: Adjust training load conservatively
If your goal is performance, the biomarker framework is most useful when it prompts early, moderate adjustments. Consider:
- Reducing intensity (less time at high heart rate or power)
- Shortening sessions
- Adding an extra rest day
- Prioritizing sleep and nutrition
Then watch whether HRV rebounds and RHR normalizes over the next few days. If the signals improve, it supports that the change was driven by recovery status rather than a persistent issue.
Step 4: Consider when to seek medical guidance
Biomarkers are not a replacement for medical evaluation. Consider professional advice if you have persistent symptoms (chest pain, fainting, shortness of breath at rest, unexplained fatigue) or if HRV and RHR changes occur alongside illness that doesn’t improve. If you’re on medications that affect heart rate or autonomic tone (for example, beta blockers), interpretation should be done with clinician guidance.
How to build a reliable interpretation routine
To make VO2max HRV resting heart rate interpretation useful, you need consistency in both measurement and review. A simple routine can help you reduce noise and make signals more actionable.
Maintain measurement consistency
- Wear the device snugly and consistently (especially for HRV).
- Use the same sleep window when possible.
- Keep caffeine timing and alcohol intake consistent across baseline periods.
Track weekly summaries
Instead of reacting to every daily number, review weekly patterns:
- Average HRV relative to your personal baseline
- Average RHR relative to your personal baseline
- Whether VO2max estimates increased, stayed stable, or decreased over the longer term
This approach helps you distinguish normal variability from meaningful physiological shifts.
Pair the data with training response
HRV and RHR are most meaningful when they match your lived experience. If HRV is low and RHR is elevated but workouts feel strong, the change may be due to a non-training factor. If HRV is low and RHR is elevated and workouts feel unusually hard, that alignment strengthens the recovery-under-stress interpretation.
Relevant devices and how they can influence interpretation
Many people view these metrics through devices such as Garmin, Oura, WHOOP, Apple Watch-based fitness analytics, and other wearable platforms. While the general principles of autonomic stress and recovery apply across devices, the exact HRV metric, sampling method, and VO2max estimation algorithm differ.
Practical guidance:
- Don’t mix baselines across devices: if you switch wearables, your HRV numbers may change even if your physiology hasn’t.
- Use the same platform long enough to establish a personal baseline.
- Interpret VO2max estimates in context: if you change training style, the algorithm’s inputs change too.
If you’re using a platform that provides recovery or readiness indicators derived from HRV and RHR, treat those as summaries—not as absolute truth. Confirm with how you feel and how your training adapts.
Summary: a grounded approach to interpreting VO2max, HRV, and resting heart rate
VO2max, HRV, and resting heart rate each reveal a different layer of your fitness and recovery status. VO2max represents longer-term aerobic capacity, while HRV and RHR provide short-term information about autonomic balance and baseline cardiac load. The most reliable interpretation comes from patterns across multiple days, not single readings.
- Best-case adaptation: VO2max trends up with HRV stable or improving and RHR stable or decreasing.
- Common recovery concern: HRV down and RHR up together for several days often suggests under-recovery, stress, or early illness.
- Time horizon matters: VO2max changes more slowly; HRV and RHR can shift quickly.
- Measurement context matters: sleep, sensor quality, caffeine, hydration, and device algorithms can all influence readings.
Used correctly, VO2max HRV resting heart rate interpretation becomes a practical way to detect when your body is ready for harder training and when it needs recovery. The goal isn’t to chase perfect numbers—it’s to understand your trends, reduce avoidable stressors, and respond early when the signals indicate you’re accumulating more load than you’re absorbing.
Prevention guidance: reduce noise and support recovery before it’s needed
Because HRV and RHR react quickly to lifestyle and training stress, prevention is often more effective than correction after the fact. A few evidence-aligned habits can stabilize your signals and improve recovery:
- Protect sleep consistency: regular bed and wake times reduce HRV variability.
- Manage training load: avoid large week-to-week jumps, and include lighter days.
- Hydrate and fuel: dehydration and under-fueling can raise RHR and suppress HRV.
- Be mindful with caffeine and alcohol: timing matters for both sleep and autonomic tone.
- Monitor symptoms: if you feel unwell, interpret biomarker changes as part of the bigger picture.
When you prevent excessive stress and support recovery proactively, your VO2max estimates become more meaningful and your HRV and RHR signals become easier to interpret.
08.03.2026. 02:03