Homeostasis vs Allostasis: Wearable HRV and Resting Heart Rate Metrics
Why this myth matters for wearable HRV and resting heart rate
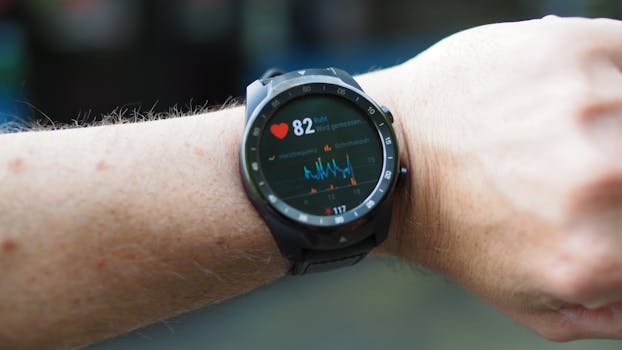
Wearable devices can estimate two popular signals: resting heart rate (RHR) and heart rate variability (HRV). Because these metrics are easy to visualize, it’s tempting to treat them as direct indicators of “health” in a single, universal way. That mindset often leads to a common misunderstanding: that your body either maintains a steady internal environment (homeostasis) or actively changes it to meet demands (allostasis), and that wearable metrics neatly reveal which mode you’re in.
In reality, human physiology uses both. The body continuously balances stability and adaptive change, and HRV and RHR can reflect both processes depending on context. This myth-busting guide explains what homeostasis vs allostasis means for interpreting wearable metrics, why HRV is not just a “stress score,” and how to handle changes in resting heart rate without jumping to simplistic conclusions.
Homeostasis and allostasis: the difference that shapes interpretation
Homeostasis describes regulatory processes that keep internal conditions within relatively stable bounds. Think of temperature regulation, blood glucose control, or maintaining a typical resting cardiovascular state under routine conditions.
Allostasis describes how the body achieves stability through change. Instead of returning to one fixed setpoint, the system adjusts to predicted or current demands—sometimes raising or lowering physiological outputs to meet performance or survival needs.
Here’s the practical implication: a wearable metric is rarely “measuring homeostasis” or “measuring allostasis” by itself. It’s measuring a downstream physiological output (heart rhythm patterns) that can be influenced by both stable regulation and adaptive reconfiguration.
How HRV and RHR connect to regulation
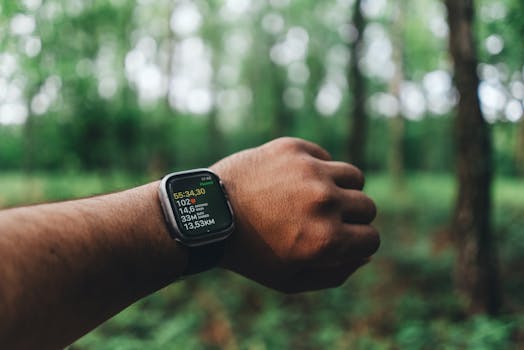
Heart rate variability (HRV) reflects beat-to-beat fluctuations in heart timing. Those fluctuations are strongly shaped by autonomic nervous system activity (especially parasympathetic influence) and by broader regulatory inputs such as respiration, stress hormones, inflammation, and sleep quality.
Resting heart rate (RHR) is the heart rate during a low-activity state. It can shift due to hydration status, illness, sleep debt, temperature, training load, emotional stress, caffeine, and changes in autonomic balance.
Neither metric is a direct “homeostasis vs allostasis label.” Instead, the body’s regulatory strategy influences the heart’s rhythm and baseline rate—so the same metric change can arise from different mechanisms.
The myth: HRV “proves” you’re calm, recovered, or in homeostasis
Many interpretations treat HRV like a simple scoreboard: higher HRV equals calm recovery; lower HRV equals stress or poor health. This is an oversimplification that ignores why HRV changes.
Why HRV is context-dependent
HRV is influenced by multiple overlapping factors:
- Respiration: Breathing rate and depth can strongly affect HRV because respiratory sinus arrhythmia changes beat-to-beat timing.
- Sleep stage: HRV patterns vary across sleep stages; a night with different sleep architecture can change HRV even if you feel fine.
- Training and fatigue: After hard sessions, HRV can drop temporarily—sometimes reflecting recovery demands, not permanent dysfunction.
- Illness and inflammation: Even mild infections can reduce HRV before symptoms are obvious.
- Autonomic balance: HRV can change with shifts between sympathetic and parasympathetic influence, which can occur for many reasons (stress, pain, thermoregulation, travel).
Allostasis is central here. When the body anticipates or responds to demands, it may alter autonomic output and cardiovascular dynamics. HRV may decrease while the system is actively adapting. So the myth fails because it assumes HRV is a one-dimensional indicator of “being in the stable mode.”
Wearable HRV measurement limitations
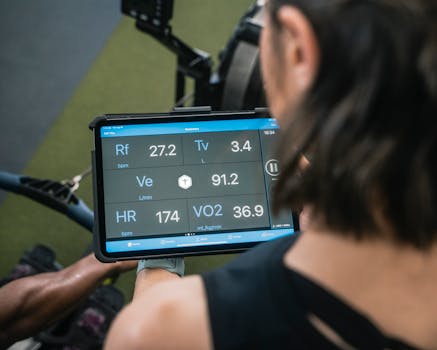
Wearables estimate HRV using optical sensors (photoplethysmography) or electrocardiography depending on the device. Optical HRV can be sensitive to movement, skin contact, ambient light, and sensor fit. Even if a device performs well, the signal is not identical to clinical-grade measurements.
This doesn’t mean HRV is useless. It means interpretation should emphasize trends and context rather than single-day judgments.
The myth: resting heart rate is a direct “stress gauge” or a single health score
Resting heart rate is often treated as a straightforward proxy for stress, fitness, or recovery. But RHR is a composite output influenced by many variables, including both stability and adaptive change.
Common reasons RHR changes that aren’t “bad health”
- Sleep quality: Poor sleep can elevate RHR the next day.
- Dehydration or illness: Mild dehydration or early infection can raise baseline heart rate.
- Temperature and environment: Heat can increase resting rate; cold exposure can also shift baseline autonomic tone.
- Caffeine, alcohol, and timing: Effects can persist into the next day depending on dose and metabolism.
- Training load: High training stress can elevate RHR during recovery windows.
- Emotional stress: Stress responses can raise resting rate even when HRV interpretation is ambiguous.
Because these influences are common and often reversible, a single elevated RHR reading should not be treated as a definitive sign of “allostasis gone wrong” or “homeostasis failing.” It’s better to view RHR as a signal that the body’s baseline cardiovascular regulation has shifted—temporarily or persistently—due to current conditions.
What “homeostasis vs allostasis” looks like in HRV and RHR trends
A more useful approach is to interpret patterns over time, across contexts. Homeostasis tends to produce relatively stable baselines under consistent conditions. Allostasis shows up as deliberate shifts that help meet demands.
Scenario patterns you might see
Consider how the same metric direction can mean different things depending on context:
- After a hard workout: RHR may rise and HRV may drop for a short period. This can reflect adaptive recovery demands (allostasis) rather than a permanent problem.
- During travel or schedule disruption: Sleep changes can alter both HRV and RHR. The body adapts to new routines; the metrics shift accordingly.
- When you’re consistently under-recovering: Over multiple days, RHR may stay elevated and HRV may remain suppressed. This can suggest a sustained mismatch between demands and recovery—still adaptive, but potentially maladaptive if persistent.
- When you’re well-rested and consistent: HRV may trend higher (within your normal range) and RHR may trend lower or stable.
The key is that homeostasis vs allostasis is not an either/or switch. It’s the framing that helps you ask: “Is my body adapting to demand, or is my baseline regulation stuck in a stressed state?” Wearables can support that question, but they can’t answer it alone.
How to interpret wearable HRV and RHR without common traps
Myth-busting interpretation starts with method. Most errors come from treating wearable metrics as absolute truth or from ignoring the measurement process.
Use personal baselines, not universal thresholds
HRV and RHR vary widely between individuals due to age, sex, fitness level, genetics, breathing patterns, and sensor differences. Many online claims rely on generic thresholds that don’t fit real-world physiology.
Instead, track your own typical range under stable lifestyle conditions. Look for deviations relative to your baseline rather than relative to someone else’s numbers.
Prioritize trends around meaningful events
Ask what changed in the 24–72 hours before the metric shift:
- Hard training or reduced training?
- Sleep duration and quality?
- Illness symptoms or exposure?
- Caffeine timing, alcohol, hydration?
- Travel, stress, or major schedule changes?
HRV is particularly sensitive to sleep and breathing. RHR is sensitive to overall baseline physiological load. If you log context, your interpretation becomes far more reliable.
Be cautious with “recovery scores” and normalized HRV
Many wearables provide a “readiness,” “recovery,” or “stress” metric derived from HRV, RHR, sleep, and sometimes activity patterns. These scores can be useful as internal indicators, but they are not standardized across brands and algorithms.
If you want to connect the physiology to homeostasis vs allostasis framing, focus on the raw or minimally processed signals when available and on how they change with your real-world context.
Account for measurement quality
Optical sensors can misread when the device is loose, when the skin is cold, or after vigorous movement. If HRV spikes or drops dramatically without a plausible explanation, consider whether the measurement quality was likely compromised.
Practical tip: ensure consistent device placement, keep the sensor snug (not painful), and compare day-to-day patterns rather than reacting to a single outlier.
Practical guidance: what to do when HRV drops or RHR rises
Wearable metrics can be early signals, but they should guide decisions in a measured way. The goal is not to “optimize” numbers at all costs; it’s to align activity and recovery with the body’s current demands.
Step 1: confirm the change is real (and not a sensor artifact)
- Check whether HRV was measured under similar conditions (sleep vs wake time, consistent sensor fit).
- Look for confirmation across multiple days, not a single reading.
- Compare RHR and HRV together; consistent direction across signals is more informative.
Step 2: map likely drivers using a short checklist
- Sleep: fewer hours, fragmented sleep, or known disturbances?
- Training: did you do hard intervals, increase volume, or reduce recovery?
- Illness: sore throat, congestion, new fatigue, or unusual body aches?
- Stimulants: caffeine later than usual, alcohol, or new supplement timing?
- Stress: mental strain, conflict, high workload, travel?
Step 3: respond proportionally
Common evidence-based responses are behavioral and low-risk:
- Prioritize sleep duration and regularity for a few nights.
- Reduce training intensity or volume briefly if the change follows a heavy training block.
- Hydrate and ensure adequate nutrition, especially after higher activity.
- Monitor symptoms. If you feel unwell or have concerning cardiovascular symptoms, seek medical evaluation rather than relying on wearables.
This is where the homeostasis vs allostasis framing helps: a short-term change can represent adaptive allostasis. Persistent or worsening changes—especially with symptoms—may indicate sustained strain that requires professional assessment.
Where wearable data can help, and where it cannot
Wearables are best viewed as signals for patterns, not diagnostic tools. The body’s regulatory systems are complex, and heart rhythm metrics reflect many pathways beyond autonomic balance.
Useful applications
- Detecting recovery mismatch: repeated HRV suppression with elevated RHR may track under-recovery across days.
- Monitoring lifestyle effects: sleep changes, stress periods, and travel often show up in HRV and RHR.
- Supporting training planning: trends can help you adjust intensity rather than following a rigid schedule.
Limits and risks of overinterpretation
- False certainty: a wearable can suggest changes without revealing the mechanism.
- Algorithm opacity: readiness scores combine multiple signals; the “why” is not transparent.
- Individual variability: two people can show opposite HRV-RHR patterns and still be healthy, depending on baseline physiology.
In myth terms: the misconception is that you can directly read “homeostasis” or “allostasis” from HRV and RHR alone. The better claim is that these metrics can help you notice when your baseline regulation is shifting and to investigate plausible drivers.
Prevention guidance: build a physiology-first measurement habit
If you want to use wearable metrics responsibly, the prevention strategy is to reduce noise and increase interpretability.
- Track context: sleep duration, training intensity, and major stressors.
- Look for multi-day patterns: single-day reactions lead to overcorrection.
- Maintain measurement consistency: device placement, charging routines, and sensor fit.
- Use symptom awareness: if RHR is elevated with chest pain, fainting, shortness of breath, or other concerning symptoms, prioritize medical evaluation over wearable interpretation.
Homeostasis vs allostasis is best understood as a dynamic balance. Wearable HRV and resting heart rate can give you a window into that balance—but only when you interpret them as part of a broader physiological and behavioral story.
Summary: the myth-busting takeaway for homeostasis vs allostasis wearable metrics
The myth is that HRV and resting heart rate cleanly reveal whether your body is in “homeostasis” or “allostasis,” or that HRV alone equals calm recovery. In practice, both regulatory strategies operate continuously. HRV and RHR reflect downstream cardiovascular dynamics influenced by sleep, respiration, training load, illness, hydration, environment, and autonomic balance.
To interpret wearable metrics well, focus on personal baselines, measurement quality, and context-driven trends. When HRV drops or RHR rises, treat the signals as prompts to check plausible drivers and adjust recovery proportionally—rather than as definitive proof of a single physiological state.
28.01.2026. 04:15