

Longevity Sleep Metrics: ODI, SpO2, HRV, and RHR Explained

Why sleep metrics matter for longevity
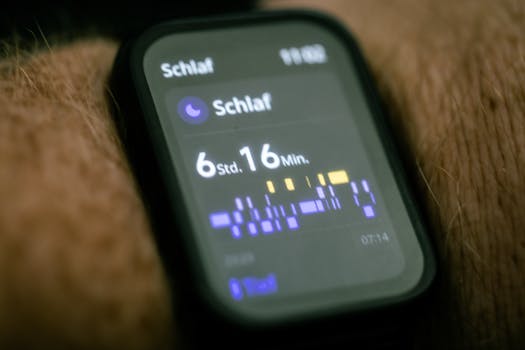
If you care about longevity, sleep is not just “rest.” It is a daily recovery process that shapes metabolic health, cardiovascular risk, immune function, and brain resilience. The challenge is that sleep quality is partly invisible. You can’t easily see nighttime breathing instability or subtle shifts in autonomic nervous system balance.
This is where wearable sleep metrics become useful. Modern devices can estimate patterns across the night and summarize them into numbers you can track over time. The goal is not to chase perfect scores. The goal is to notice meaningful trends that may indicate breathing disruption, oxygen desaturation, or recovery strain—then respond appropriately with medical evaluation when needed.
In this guide, you’ll learn how to interpret key longevity sleep metrics commonly reported by wearables: ODI, SpO2, HRV, and RHR. You’ll also see how to use these metrics responsibly—especially when you’re deciding whether a pattern is likely to be noise versus a signal worth acting on.
Core wearable metrics for longevity sleep
Wearables vary in sensors and algorithms, but several metrics recur across platforms and device types (wrist-based optical sensors, finger pulse oximetry, and integrated heart-rate/HRV models). Below are the four metrics most relevant to longevity-focused sleep monitoring.
ODI: oxygen desaturation events per hour
ODI stands for Oxygen Desaturation Index. In sleep medicine, it usually refers to the number of times per hour your blood oxygen drops by a clinically meaningful amount, commonly 3% or 4%, from a baseline. Many consumer devices approximate this using wrist pulse oximetry and their own event-detection rules.
Why ODI matters for longevity: repeated oxygen drops during sleep can increase oxidative stress and sympathetic nervous system activity. Over months and years, that pattern is associated with higher cardiovascular risk and metabolic dysfunction—especially when it reflects obstructive sleep apnea (OSA) or related breathing disorders.
Important nuance: ODI is not the same thing as a single SpO2 reading. Two people can have the same average SpO2 but very different ODI values. Longevity risk is more tied to recurrent desaturation events and their timing than to one averaged number.
SpO2: oxygen saturation levels during sleep
SpO2 is the percentage of hemoglobin saturated with oxygen. Wearables typically report average SpO2, minimum SpO2, and sometimes time-below-threshold estimates (for example, time under 90% or 92%, depending on the device).
Why SpO2 matters: sustained low oxygen or frequent dips can stress the body and disrupt sleep architecture. However, SpO2 from wrist sensors can be noisy—especially during movement, loose fit, cold skin, or poor sensor contact.
Practical interpretation: treat SpO2 as a trend metric. Look for consistent patterns across nights using similar conditions (same fit, similar bedtime routine) rather than reacting to a single outlier night.
HRV: heart rate variability and autonomic balance
HRV represents variations in time between heartbeats (often measured as RMSSD or similar time-domain metrics). In sleep and recovery contexts, HRV is commonly used as a proxy for autonomic regulation—particularly the balance between sympathetic (“fight or flight”) and parasympathetic (“rest and digest”) activity.
In longevity science, HRV is interesting because chronic stress physiology and impaired recovery are linked to higher risk across multiple systems. Sleep breathing disruption can also reduce HRV by increasing sympathetic drive.
Key nuance: HRV is highly individual. Age, fitness, sleep timing, alcohol, illness, caffeine timing, hydration, and even menstrual cycle can shift HRV. Your baseline matters more than population averages.
RHR: resting heart rate as a recovery and strain marker
RHR is your resting heart rate, typically measured overnight while you’re still or asleep. Lower RHR often reflects better cardiovascular efficiency and recovery, but “lower is always better” is not universally true. RHR can rise temporarily with stress, poor sleep, dehydration, infection, or increased training load.
Why RHR matters for longevity: persistently elevated RHR can reflect ongoing physiological strain. When combined with sleep breathing metrics, RHR can help you distinguish “I had a rough night” from “my sleep recovery system is under chronic load.”
How these metrics connect to sleep physiology
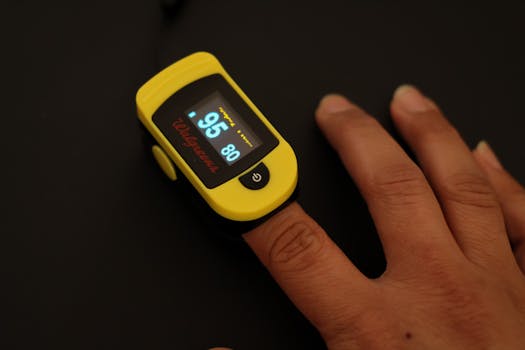
To interpret the numbers, it helps to understand the chain of events that can occur during a night with breathing instability.
When upper airway resistance increases—often during certain sleep stages or body positions—breathing can become partially obstructed. Oxygen saturation may drop. This triggers arousals and increased sympathetic activity. In the morning, you may see:
- Higher ODI (more desaturation events per hour)
- Lower minimum SpO2 or more time spent below a threshold
- Reduced HRV (less parasympathetic recovery, more autonomic activation)
- Higher RHR (a body still “revved up,” even at rest)
These patterns are not guaranteed. Some people maintain stable SpO2 but still experience fragmented sleep and autonomic changes. Others may have ODI events without dramatic HRV changes in the short term. That’s why you should look at the combined picture over time.
ODI and SpO2: practical thresholds and what they usually mean
Wearables don’t use identical definitions. Still, you can use general sleep-medicine logic when you interpret ODI and SpO2 patterns.
Common ODI ranges used in clinical contexts
In clinical sleep studies, ODI values are often interpreted in relation to sleep-disordered breathing severity. Many clinicians use ranges similar to these:
- Low: fewer than ~5 events per hour
- Mild: ~5–14 events per hour
- Moderate: ~15–29 events per hour
- High: 30 or more events per hour
Consumer devices may estimate ODI differently (for example, event detection sensitivity and desaturation thresholds). So use these ranges as directional guidance, not as a diagnosis.
SpO2 patterns that deserve attention
Rather than obsessing over one minimum reading, focus on patterns like:
- Repeated drops to low values (for example, frequent dips near 90% or below, depending on your device’s reporting)
- Time spent below a threshold (some devices estimate minutes below 90% or 92%)
- Consistent reduction across multiple nights, especially when ODI is also elevated
Real-world scenario: Imagine you wear a wrist device for 30 days. Most nights your average SpO2 is around 96–97%, and your ODI estimate is usually under 5. Then, for 10 consecutive nights, your ODI estimate rises to 12–18, and your minimum SpO2 repeatedly dips into the low 90s (even if average SpO2 stays near 95–96%). You also notice morning RHR is 4–8 bpm higher than your usual baseline and HRV is lower. In this scenario, you shouldn’t conclude “the device is wrong.” You should treat it as a signal to investigate breathing quality—especially if you also snore, wake with dry mouth, or feel unrefreshed.
When measurement error is likely
ODI and SpO2 estimates are most vulnerable to sensor issues. Consider measurement error if:
- The band is loose or slides during sleep
- Your skin is cold (wrist sensors can underperform)
- You had a lot of movement or unusual sleep posture
- Your SpO2 readings fluctuate wildly night-to-night with no consistent pattern
A good practice is to standardize your setup: consistent band placement, snug fit (not painful), and similar bedtime routines. Then compare trends.
HRV and RHR: how to interpret recovery signals
HRV and RHR can be powerful, but they are easy to misinterpret if you treat them as standalone “scores.” You’ll get more value by using them to answer specific questions: “Is my recovery better or worse than my baseline?” and “Does this align with breathing metrics or illness stress?”
HRV: look for direction and consistency
HRV often declines after poor sleep, alcohol intake, late-night eating, high training load, or stress. It may also decline temporarily during viral illness. The key is to compare your HRV to your own baseline.
Practical approach:
- Track HRV nightly for at least 2–4 weeks to establish a personal baseline.
- Then look for patterns: a sustained drop (for example, 15–30% below your baseline for several nights) is more meaningful than a single low reading.
Also consider your “context markers.” If HRV drops and RHR rises after a night with frequent awakenings, that’s more likely a recovery issue. If HRV drops but ODI and SpO2 are stable, the cause may be stress, caffeine, alcohol, or training load rather than breathing.
RHR: use it as a “strain thermometer,” not a grading rubric
RHR can rise with many factors. Still, you can extract useful information by focusing on:
- Baseline: your typical RHR when sleep and daily stress are stable.
- Delta: how much higher it gets during problematic weeks (for example, +5 bpm vs +15 bpm).
- Duration: whether elevation persists for multiple days.
Real-world scenario: You’re training for a 10K. During peak training week, your RHR increases by 6–8 bpm and HRV drops. ODI and SpO2 remain stable. That pattern likely reflects training load and recovery demands rather than sleep-disordered breathing. If, however, ODI and minimum SpO2 also worsen during that same week and you notice more night waking, the issue could be compounded—breathing disruption may limit your ability to recover from training.
Using longevity sleep metrics together (a decision framework)
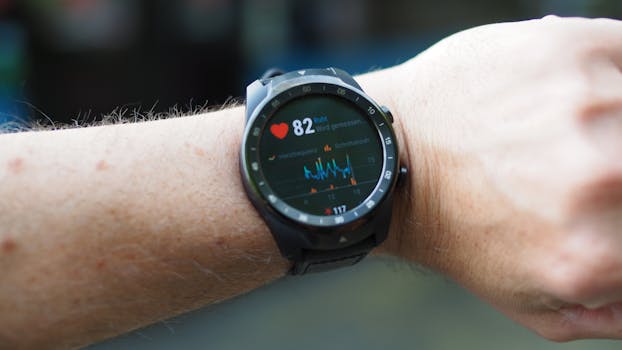
Longevity metrics work best when you combine them into a coherent picture. Here’s a practical framework you can use without needing a medical degree.
Step 1: Establish your baseline
Start by collecting data for 2–4 weeks. Aim for consistent device wear and similar sleep timing. During this period, note your typical ranges for:
- ODI estimate (or equivalent desaturation frequency)
- SpO2 average and minimum
- HRV (your personal typical value)
- RHR (your typical morning/overnight resting value)
Baseline is the anchor. Without it, you can misread normal variability as a problem.
Step 2: Look for coordinated changes
Coordinated changes across metrics are more informative than any single metric:
- If ODI rises and SpO2 dips more often, you’re likely seeing breathing instability.
- If ODI rises and HRV drops while RHR rises, your recovery may be impaired by that instability.
- If HRV drops and RHR rises but ODI/SpO2 remain stable, consider stress, illness, alcohol, late meals, or training load as likely contributors.
Step 3: Confirm with symptoms and sleep context
Metrics are stronger when they match real-world symptoms. Consider whether you have:
- Snoring, gasping, or choking during sleep
- Dry mouth on waking
- Morning headaches
- Unrefreshing sleep despite adequate time in bed
- Excessive daytime sleepiness
If your device metrics suggest breathing disruption and you have these symptoms, it’s more likely the signal is clinically meaningful.
Practical guidance: how to improve data quality and interpret trends
Wearable sleep metrics are only as useful as the measurement conditions. You can reduce noise and improve interpretability with a few habits.
Fit, placement, and skin conditions
- Wear the band consistently in the same location on your wrist.
- Keep it snug enough to avoid sliding, but not so tight that it causes discomfort or numbness.
- If you sleep in a cold environment, consider warming the area before bed; cold skin can reduce optical sensor performance.
Consistency in bedtime routines
Try to keep bedtime and wake time within a reasonable range. If your schedule shifts by 2–3 hours for weeks, HRV and RHR trends may reflect circadian disruption rather than breathing or recovery changes.
Control confounders when you’re testing a change
If you want to learn whether an intervention affects your sleep metrics, change only one variable at a time for a short window (for example, 7–14 nights). Examples of variables that strongly affect HRV and RHR:
- Alcohol within 4–6 hours of bedtime
- Caffeine late in the day
- Late heavy meals
- Hard training sessions close to bedtime
- Major stress events
For ODI and SpO2, confounders can include sleeping position (supine vs side), nasal congestion, and alcohol (which can increase airway collapsibility for some people).
What to do when metrics suggest sleep-disordered breathing
If ODI and SpO2 trends suggest repeated desaturation events, the most important next step is a clinical evaluation. Consumer devices can be screening tools; they cannot replace diagnostic sleep testing.
When to consider medical assessment
You should seriously consider a sleep medicine consultation if you see patterns like:
- ODI consistently in a higher range (for example, repeatedly above ~15 events/hour in the device’s estimate)
- Repeated low SpO2 readings or substantial time below a threshold
- Symptoms that align with sleep-disordered breathing (snoring, gasping, morning headaches, unrefreshing sleep)
- Concordant recovery impairment (lower HRV and higher RHR on nights with worse ODI)
If you have known cardiovascular disease, resistant hypertension, or significant metabolic disease, it’s especially important to take sleep-disordered breathing signals seriously and not delay evaluation.
What a clinician may do next
A sleep specialist may recommend an in-lab polysomnography or a home sleep apnea test depending on your risk profile and symptoms. These tests measure airflow, respiratory effort, oxygen saturation with clinical-grade oximetry, and sleep stages more directly than wearables.
Your wearable data can be helpful context. Bring a summary of your trends (for example, typical ODI estimate, typical SpO2 average/minimum, and how these changed over 2–4 weeks) rather than focusing on single-night extremes.
How to use longevity sleep metrics for ongoing self-optimization
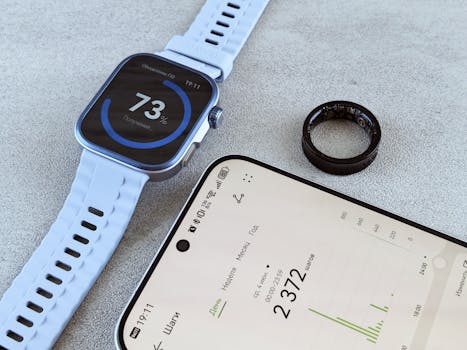
Longevity is a long game. You’ll get the most value from metrics when you treat them as feedback loops for sustainable habits.
Breathing-focused habits that may reduce desaturation events
Depending on your situation, some practical steps can reduce breathing instability:
- Sleep position: many people experience worse breathing when sleeping on their back. If your device data worsens after nights where you slept supine, side sleeping may help.
- Manage nasal congestion: nasal blockage can increase airway resistance and worsen OSA symptoms for some individuals.
- Alcohol timing: alcohol can increase upper airway collapsibility and reduce stability of breathing during sleep for many people. If ODI rises after nights with alcohol, that pattern is informative.
- Weight and metabolic factors: body composition changes can affect airway mechanics. Even modest changes can influence severity in some individuals, though this requires time.
These are not universal cures, but they can be meaningful levers you can test while tracking ODI and SpO2 trends.
Recovery-focused habits that often improve HRV and RHR
HRV and RHR respond to many recovery inputs. Consider:
- Regular sleep timing: consistent circadian timing supports autonomic stability.
- Training load management: if RHR rises and HRV drops during peak training blocks, you may need recovery days.
- Evening light and screen habits: excessive late light can delay sleep onset and reduce sleep depth for some people.
- Evening nutrition: very late or very heavy meals can worsen sleep quality and autonomic recovery.
Track HRV and RHR for 1–2 weeks after a change to see whether the direction stabilizes.
Limitations: what wearables can and can’t tell you
To use longevity sleep metrics responsibly, you must understand their limits.
Optical sensors are indirect measurements
Wrist SpO2 and ODI estimates are derived from optical pulse signals. They can be affected by motion, skin tone, tattoos, sensor fit, and temperature. That means you should treat ODI and SpO2 as screening-level indicators rather than definitive clinical measurements.
Algorithms differ across brands and firmware updates
Two devices may report different ODI values from the same night. Algorithms can change with firmware updates. For best interpretation, stick to one device (or at least one measurement method) for trend tracking.
HRV is sensitive to personal and situational factors
HRV can change from exercise, stress, illness, hydration, and even breathing pattern changes. It’s valuable, but it’s not a single-cause metric. Use it to support your broader interpretation, not to conclude a diagnosis.
Putting it all together: an example of a responsible metrics workflow
Here’s a practical workflow you can adopt over the next month.
Week 1: Baseline and data quality
- Wear the device consistently and ensure good sensor contact.
- Record your typical bedtime and wake time.
- Note any nights with alcohol, late meals, or illness.
At the end of the week, identify your approximate baseline for ODI, SpO2, HRV, and RHR.
Week 2: Identify patterns, not single nights
- Look for nights where ODI is clearly higher than your baseline (for example, above your usual range by a noticeable margin).
- Check whether HRV drops and RHR rises on those same nights.
- Confirm whether you had symptoms like snoring or waking unrefreshed.
Week 3: Test one variable
Choose a single plausible lever. Examples:
- If you suspect positional effects, prioritize side sleeping.
- If you drink alcohol, test alcohol-free nights for 7–10 days.
- If nasal congestion is an issue, improve it consistently and track changes.
Then observe whether ODI and SpO2 stabilize and whether HRV and RHR improve.
Week 4: Decide whether to escalate
If metrics consistently suggest breathing disruption and symptoms support it, consider a sleep evaluation. If metrics improve with behavioral changes and symptoms are absent, you can continue monitoring and focus on recovery optimization.
The point is not to “solve” sleep overnight. It’s to create an evidence-based feedback loop that respects both biology and measurement limitations.
Summary: using longevity sleep metrics to protect recovery
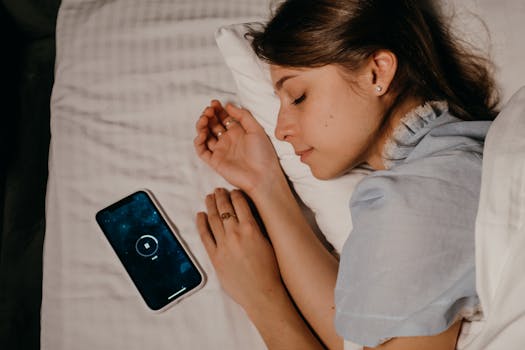
Longevity sleep metrics wearables can help you observe patterns that affect long-term health—especially oxygen desaturation and recovery strain. ODI and SpO2 offer insight into breathing stability during sleep, while HRV and RHR provide a window into autonomic recovery and physiological load.
To use these metrics well:
- Build a personal baseline over 2–4 weeks.
- Interpret ODI and SpO2 as trend signals, not single-night verdicts.
- Use HRV and RHR to understand whether recovery is impaired in the same nights that breathing metrics worsen.
- Account for sensor limitations and confounders like alcohol, late meals, illness, and training load.
- If breathing-disruption patterns persist and symptoms align, seek clinical assessment rather than self-diagnosing from wearables.
When you combine thoughtful measurement with real-world context, these longevity sleep metrics can become a practical tool for protecting the system that drives your health every night.
14.02.2026. 22:29