

SpO2 vs ODI accuracy: what to look for

Why SpO2 and ODI accuracy matters for you
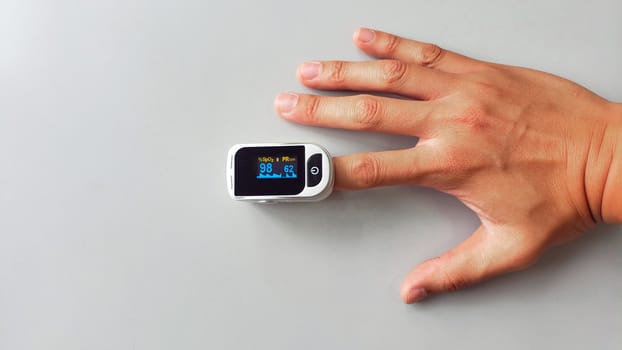
If you’re reviewing a sleep study—or comparing results from different devices—you’ll quickly run into two terms that sound similar but measure different things: SpO2 and ODI. SpO2 is oxygen saturation at a moment in time. ODI (oxygen desaturation index) summarizes how often oxygen levels drop during sleep. Both can be clinically useful, but their accuracy is not the same thing as “precision,” and it’s not guaranteed across devices, sensors, or reporting settings.
When SpO2 and ODI are inaccurate, the downstream interpretation can be off too. You might see desaturation events that aren’t real, miss true events, or misjudge severity. That matters because clinicians often use oxygen patterns alongside airflow signals to evaluate conditions like obstructive sleep apnea, nocturnal hypoxemia, or other respiratory issues.
This guide helps you understand what accuracy really means for SpO2 vs ODI, how to spot common failure modes, and what to look for in the data before you assume the numbers are correct.
SpO2 vs ODI: what each metric actually measures
What SpO2 tells you
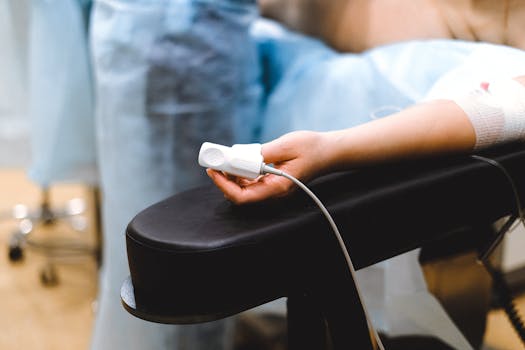
SpO2 (peripheral capillary oxygen saturation) is an estimate of blood oxygen level derived from pulse oximetry. Most consumer and clinical oximeters use optical sensors that measure light absorption changes in pulsatile blood. The output is usually updated once per second (or faster), then smoothed or averaged internally.
SpO2 is sensitive to signal quality. Motion, poor sensor contact, skin pigmentation, low perfusion, cold extremities, and nail polish can all degrade the photoplethysmography signal. In practice, SpO2 is most reliable when the waveform quality is good and the sensor is stable for long uninterrupted segments.
What ODI summarizes
ODI is typically defined as the number of oxygen desaturation events per hour of sleep. The most common thresholds are “ODI4%” and “ODI3%,” meaning desaturations of at least 4% or 3% from baseline, respectively, followed by recovery within a specified time window. Some systems report “ODI events” based on a minimum duration and a minimum separation between events to avoid counting the same event twice.
Because ODI is derived from SpO2 over time, its accuracy depends on:
- SpO2 sampling accuracy (how close the measured values are to true oxygen saturation)
- SpO2 time resolution (how well short drops are captured)
- Event detection logic (how the device defines baseline, recovery, and event separation)
- Sleep time estimation (whether “per hour” is based on actual sleep vs recording time)
How accuracy is evaluated: clinical standards vs real-world performance
Look for measurement error specs, not just “it’s accurate”
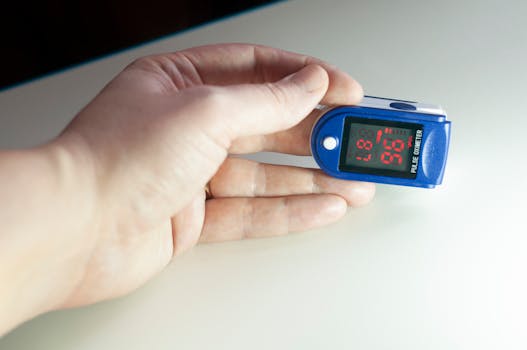
For SpO2, manufacturers may cite accuracy such as “±2%” within a certain SpO2 range under controlled conditions. That’s helpful, but it’s not the whole story. Accuracy claims are usually based on laboratory protocols with stable perfusion and minimal motion. Your home or clinic environment is rarely that controlled.
For ODI, accuracy is trickier because it’s not a direct measurement like a single SpO2 value. It’s a calculated outcome. Two devices can both report “ODI4%” but use different algorithms: baseline tracking, smoothing, and event counting rules can shift the ODI number even if the raw SpO2 looks similar.
Real-world factors that change ODI more than SpO2
ODI is especially affected by how the device handles noisy data. If motion artifacts create brief dips in SpO2, the event detector may count them as desaturations, inflating ODI. Conversely, if the device smooths or filters aggressively, it may blunt short desaturations and reduce ODI.
In other words: SpO2 accuracy problems can become ODI accuracy problems, but not always in a predictable direction.
What to look for in SpO2 waveform quality and signal reliability
Check for a stable pulse waveform
When you review oximetry data, the most practical question is: Was the signal trustworthy? Many platforms provide a pulse quality indicator or a waveform display. Even if you don’t see a waveform, you can look for “good signal” vs “poor signal” flags, or sections where the device stopped recording.
As a rule of thumb, if you see long stretches of low-quality signal, the ODI derived from that segment is less reliable. A short period of artifacts can still matter if it happens during long baselines where ODI thresholds are sensitive.
Watch for common artifact patterns
Several artifacts can produce desaturation-like dips:
- Motion spikes: sudden drops and rebounds that don’t match breathing physiology
- Loose sensor contact: gradual drift followed by abrupt changes
- Low perfusion: noisy readings with inconsistent pulse strength
- Cold hands: delayed or unstable waveform and “stair-step” SpO2 changes
In a practical review, you can often correlate suspicious dips with periods of movement or with gaps in pulse quality. If your ODI is high but the SpO2 trace shows many abrupt, narrow dips that don’t look physiologically plausible, that’s a warning sign.
Consider the physiological plausibility of the drops
True desaturations in sleep apnea typically have a characteristic relationship to events in breathing: airflow obstruction leads to oxygen drops that may last tens of seconds, not instantaneous blips. If the SpO2 signal shows frequent, extremely short dips (for example, one or two seconds) that repeatedly cross the ODI threshold, those are more likely artifacts or filtering issues than true oxygen desaturation events.
ODI accuracy depends on definitions: thresholds, event rules, and sleep time
Confirm the threshold: ODI3% vs ODI4% changes the number
When you see “ODI” in a report, you should look for the threshold. ODI4% counts desaturations of at least 4% from baseline. ODI3% uses a lower threshold and will usually produce a higher ODI value. If you compare results from two devices with different thresholds, the numbers won’t be directly comparable.
Even within “ODI4%,” the baseline definition matters. Some algorithms determine baseline using a moving window; others use a fixed baseline until recovery. That can change which dips qualify as separate events.
Event separation rules and minimum duration affect counting
Most ODI algorithms include rules to prevent double-counting the same desaturation. For example, they may require a certain minimum time before a new event can start, such as 10–30 seconds, and may require the desaturation to persist for a minimum duration.
If your device uses a short separation window, it may count multiple events during one prolonged desaturation. If it uses a long separation window, it may merge nearby events and undercount ODI.
“Per hour” uses sleep time—how is sleep estimated?
ODI is usually reported “per hour of sleep.” But many home devices don’t directly measure sleep stages. They estimate sleep from signal patterns or use recording time as a proxy. If the device overestimates sleep time, ODI may be lower than it would be if only actual sleep were counted. If it underestimates sleep time, ODI can look artificially high.
This doesn’t mean the device is “wrong.” It means the context of the calculation matters. When you see ODI, look for whether it’s based on actual sleep time, total recording time, or a hybrid estimate.
How to compare devices without being misled
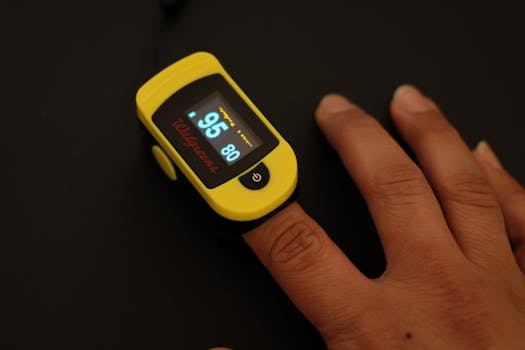
Compare the same ODI definition and the same measurement window
If you’re comparing two reports, align these details:
- ODI threshold (3% vs 4% vs other)
- Minimum desaturation duration used to qualify an event
- Event separation rule (how close two events can be)
- Sleep time basis (sleep vs recording time)
- Data quality handling (how artifacts are treated)
Without that, a difference in ODI could reflect algorithm differences rather than a real change in your oxygen physiology.
Use SpO2 summary metrics as sanity checks
Instead of relying on ODI alone, look at supporting SpO2 metrics often included in reports:
- Lowest SpO2 (nadir)
- Time below a threshold (e.g., time under 90% or 88%, if provided)
- Average SpO2 or median SpO2
If ODI is high but average SpO2 is normal and the nadir is only briefly affected, that could indicate artifacts or short-lived dips. If ODI is high and time below 90% is also elevated, that pattern is more consistent with physiologic desaturation.
Common causes of SpO2 vs ODI disagreement
Artifacts inflate ODI even when SpO2 “looks okay”
Sometimes the SpO2 trace looks acceptable at a glance, but the ODI is unexpectedly high. This can happen when:
- the device’s smoothing creates small baseline shifts that trigger threshold crossings
- pulse loss during movement causes intermittent signal dropouts
- the event detector is sensitive to brief dips near the threshold
A practical check is to review the raw or plotted SpO2 segment around each counted ODI event. If the dips are extremely narrow or coincide with obvious motion, the ODI may be overcounting.
Aggressive filtering can mask true desaturations
On the other side, some devices filter noise so strongly that short desaturations don’t register as ≥3% or ≥4% drops. That can reduce ODI even if breathing events are present. In this scenario, SpO2 might show a gradual change rather than clear step drops, and ODI may underrepresent event frequency.
This is particularly relevant if your desaturations are borderline—just around the threshold. A small difference in how the device smooths the signal can decide whether an event meets the ODI cutoff.
Baseline drift changes what counts as a “4% drop”
ODI is relative to baseline. If baseline is recalculated frequently, the same oxygen dip can be treated as a smaller or larger percentage drop depending on the algorithm. Baseline drift can occur with changing perfusion, sensor contact, or normal physiologic variability during sleep.
Two devices might both measure similar absolute SpO2 values but compute ODI differently because baseline logic differs.
Real-world scenario: reviewing a night with high ODI
Imagine you use a home device and the report shows an ODI4% of 28 events/hour. You also see that the lowest SpO2 reported is 86%, but the average SpO2 is around 96%. You feel tired, but you’re unsure whether the oxygen data reflects true physiology.
Here’s how you can approach the data like a careful reviewer:
- Step 1: Look for signal quality gaps. If the device flags poor pulse signal during certain periods, those ODI events might be unreliable. If the ODI is concentrated during movement-heavy segments, that’s a strong clue.
- Step 2: Inspect the spacing of desaturation dips. If the ODI events correspond to many very brief dips (e.g., only a few seconds), that pattern may be artifact-driven. True apnea-related desaturations often show a more sustained drop with a recovery phase.
- Step 3: Compare ODI to time-under-threshold. If time below 90% is minimal (say, only a few minutes total), the high ODI might be counting borderline events rather than prolonged hypoxemia.
- Step 4: Correlate with respiratory signals if available. Some reports include airflow or respiratory effort. If desaturation events cluster with obstructive patterns, that supports physiologic accuracy.
- Step 5: Check whether the device used sleep time or recording time. If your sleep time estimate is off, the ODI per hour can shift substantially.
In this scenario, you’re not “challenging the diagnosis” blindly. You’re verifying whether the oxygen metric is likely trustworthy. If the oxygen data is supported by good signal quality and consistent event morphology, ODI 28 events/hour is more likely meaningful. If it’s dominated by artifact periods, you may need a repeat study or a different measurement setup.
Practical steps to improve SpO2 accuracy before and during recording
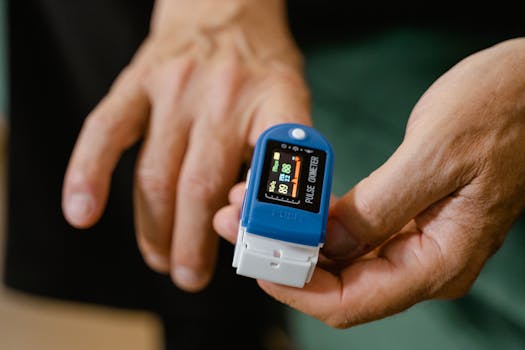
Sensor placement and stability are often the biggest variables
Before you start a recording:
- Ensure the sensor is placed correctly and securely according to the device instructions.
- Use a finger with good circulation if possible. If your hands are cold, warm them first.
- Remove nail polish and avoid very long nails that interfere with contact.
During the night, avoid excessive movement of the hand or sensor. Even if the device is designed to tolerate motion, repeated movement increases the chance of signal dropouts and false dips.
Manage factors that affect perfusion
SpO2 depends on pulsatile blood flow. Conditions that reduce perfusion—cold extremities, severe anemia, or peripheral vascular disease—can produce noisier signals. If you suspect low perfusion, interpret ODI cautiously and consider a clinically supervised test.
Look for reporting that indicates data quality handling
Some systems explicitly exclude low-quality segments from analysis, while others include them with filtering. Reports that show how much “usable” time was analyzed can guide your interpretation. If only a small portion of the night had reliable signal, ODI may not represent your typical sleep physiology.
When to treat ODI as a screening clue vs a confirmatory metric
ODI is useful, but it’s not the whole story
ODI can reflect the frequency of oxygen desaturations associated with breathing events. But oxygen desaturation is influenced by baseline oxygenation, lung function, altitude, and comorbid conditions. Some people with obstructive sleep apnea have relatively modest desaturations, while others show more pronounced oxygen drops.
So, ODI accuracy matters most when you’re using it to infer severity. If the data quality is uncertain, you should treat ODI as a clue that warrants follow-up rather than a definitive measure.
Signs that oxygen data may be clinically significant
Consider ODI more seriously when it aligns with other indicators such as:
- Repeated and sustained drops in SpO2 that match respiratory events
- Meaningful time spent below clinically relevant thresholds (for example, time under 90%)
- Consistent patterns across the night rather than isolated artifact periods
If instead ODI is high while the SpO2 trace shows inconsistent, narrow dips during motion or sensor instability, the oxygen metric may be less reliable.
How to interpret “accuracy” in reports you receive from clinicians
Ask what system was used and what it reports
In clinical settings, you may receive oximetry results from a polysomnography (PSG) system or a validated portable monitoring device. The key question is which oximetry method was used and what ODI definition it applied.
Even within “validated” devices, ODI definitions can vary. A report that states “ODI4%” is not interchangeable with “ODI3%,” and neither is interchangeable with a different desaturation threshold.
Look for the oxygen desaturation event criteria
Some reports specify the desaturation criteria such as:
- the percentage drop required (3% or 4%)
- the minimum duration of desaturation
- the recovery requirements
- the event separation window
If those criteria aren’t stated, you can still interpret trends, but you should be cautious about exact comparisons.
Prevention and follow-up: reducing measurement error next time
Repeat testing when signal quality is poor
If your first recording shows weak pulse waveform quality, frequent signal loss, or suspicious artifact-heavy segments, repeating the study with improved sensor setup is often more informative than trying to “average out” uncertainty.
Use consistency if you’re tracking changes over time
If your goal is to monitor progress—such as after treatment adjustment, positional changes, or weight changes—try to keep measurement conditions consistent: same device, similar sensor placement, similar sleep schedule, and minimal hand movement.
That consistency doesn’t guarantee perfect accuracy, but it reduces algorithmic and setup variability that can otherwise create misleading trends in ODI.
When to seek clinical evaluation
If you see concerning oxygen patterns—such as repeated low nadirs, substantial time below 90%, or symptoms that don’t match the study—discuss the results with a clinician. Oxygen issues can reflect respiratory, cardiovascular, hematologic, or environmental factors, and they sometimes require targeted evaluation beyond sleep apnea screening.
Summary: a checklist for SpO2 vs ODI accuracy
To judge SpO2 vs ODI accuracy what to look for in a practical way, focus on the measurement chain:
- SpO2 reliability starts with signal quality: stable pulse waveform, minimal artifacts, and enough usable data time.
- ODI accuracy depends on definitions: threshold (3% vs 4%), event separation rules, desaturation duration criteria, and how “per hour” sleep time is estimated.
- Look for physiologic plausibility: desaturations that are sustained and correlate with respiratory patterns are more likely true.
- Use supporting SpO2 summaries: average SpO2, nadir, and time below thresholds help validate whether ODI is likely meaningful.
- Interpret with context: high ODI with artifact-heavy or motion-correlated dips may overestimate true desaturation burden.
When you apply these checks, you’re not just reading numbers—you’re evaluating whether the numbers are measuring what they claim to measure. That’s the difference between trusting a report and being misled by it.
01.02.2026. 17:53