

Basal Body Temperature Tracking: Timing, Calibration, Data Quality

Goal: build a basal body temperature routine that produces usable fertility data
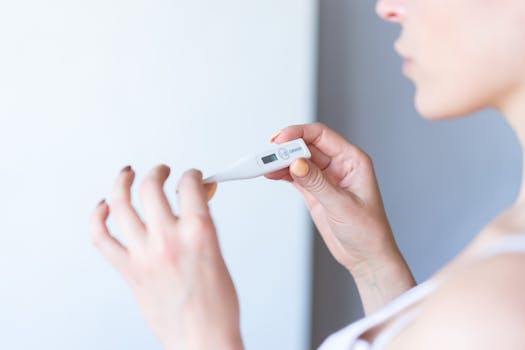
Your goal is simple: collect basal body temperature (BBT) measurements in a way that’s consistent enough to show real cycle patterns. That means two things. First, you measure at the same time every morning. Second, you calibrate your routine so your data reflects your body—not timing drift, device quirks, or inconsistent sleep.
When your timing is stable and your measurement method is consistent, your chart becomes far more interpretable. You can then look for the typical post-ovulation temperature shift and track cycle-to-cycle changes with more confidence.
Preparation: set up your timing, device, and measurement rules
Before you start, lock down the variables you control. You don’t need perfection, but you do need repeatability.
1) Choose your measurement method and stick to it
Use one thermometer type and one measurement route (oral, vaginal, or rectal). Changing routes or devices mid-cycle can create artificial shifts. If you’re currently switching methods, decide what you’ll use for at least 2 full cycles.
If you want a practical baseline, many people use a digital thermometer designed for BBT and keep it near the bedside. Some commonly used options include a basic BBT thermometer or a multi-use digital thermometer that records to 0.01°F or 0.01°C. The key is resolution and consistency, not the brand.
2) Confirm your “bedtime-to-measurement” window
Pick a target wake time you can maintain most days. For BBT, the critical factor is that you measure immediately after waking, before you get up, talk, or move around.
As a practical rule, select a routine where you can measure within 30 minutes of your target wake time. If you can only manage a wider window, you’ll need tighter calibration and stricter data-quality rules (covered below).
3) Decide how you’ll handle sleep disruption
Write down your rules before you start. Example rules you can adopt:
- If you wake for more than 20 minutes (for example, you get up to use the bathroom and stay up), you label that reading as “disrupted sleep.”
- If you sleep less than 3 hours before measuring, you label the reading “short sleep.”
- If you have a fever, you label that day “illness.”
These labels matter because BBT is sensitive to illness, alcohol, and sleep fragmentation.
4) Calibrate your device accuracy (simple checks)
You’re not trying to turn your thermometer into lab equipment. You’re trying to catch obvious issues.
- Check battery level if your device uses batteries; weak power can cause inconsistent readings.
- If your thermometer allows it, confirm it’s set to the correct unit (°F or °C) and that you’re using the same unit each day.
- Do a quick consistency check before the first cycle: take 3 readings in a row under the same conditions (for example, after 10 minutes of stillness in the same environment). The readings should be very close. If they swing widely, replace the device or troubleshoot it.
If you use a smart thermometer app, verify the app is recording the reading correctly and that time stamps match your local time.
Step-by-step: timing calibration for your basal body temperature routine
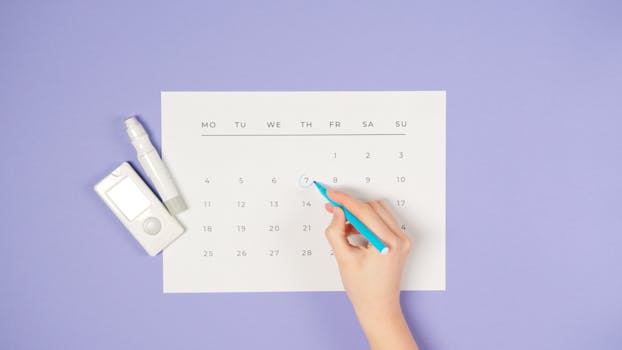
Timing calibration is where most people lose data quality. You can fix this with a structured routine and clear rules.
Step 1: Set a daily alarm for “measure now”
Choose an alarm that triggers at your target wake time. Keep the thermometer within arm’s reach. Your goal is to measure within 1–2 minutes of waking, not after you’ve scrolled your phone or checked messages.
Practical example: If you usually wake at 6:45 a.m., set the alarm for 6:40–6:45 a.m. and plan to measure immediately when it goes off. If you oversleep, follow your calibration rules in Step 4 rather than pretending the reading is comparable.
Step 2: Define your “acceptable measurement window”
Pick a window you can realistically maintain. A common setup is:
- Ideal: within 0–15 minutes of your target wake time.
- Acceptable: within 15–30 minutes.
- Lower quality: beyond 30 minutes.
Write these thresholds in your notes or your tracking app. If you routinely measure outside the ideal window, you’ll still get data, but you must treat those points as lower quality.
Step 3: Keep pre-wake behavior consistent
Consistency before measurement matters. You can reduce variability by doing the same sequence each morning:
- Lie still until you read the thermometer.
- Avoid talking.
- Avoid sitting up fully if possible; minimal movement helps.
If you have to sit up to insert the thermometer, do it the same way each time. The aim is repeatability.
Step 4: Create rules for late wake-ups and time shifts
Your body doesn’t care about your chart. Late measurements can shift BBT simply due to longer time awake. Use rules to protect the integrity of your data.
For example, adopt this policy for 2 cycles:
- If you wake within 30 minutes of your target time, record normally.
- If you wake 30–90 minutes later, still record, but mark it as “late.”
- If you wake more than 90 minutes later, consider it a “replacement day” and either pause analysis for that day or treat it as low-confidence.
This prevents you from “averaging away” a real temperature shift with timing drift.
Step 5: Standardize your thermometer handling each morning
Small handling differences can matter. Decide on a consistent routine:
- Insert and hold the thermometer the same way each time.
- Wait for the device’s completion signal (don’t remove early to save time).
- Record immediately after the signal.
Many digital thermometers beep when stable. If you remove it early, you may capture a transitional temperature instead of your true basal reading.
Step 6: Track sleep duration and sleep quality in a simple way
You don’t need a sleep study. Use a quick daily log that pairs with your temperature:
- Total sleep hours (estimate to the nearest hour).
- Any awakenings longer than 20 minutes.
- Alcohol the night before (yes/no).
- Fever/illness (yes/no).
Then, when you review your chart, you can identify days where BBT might be biologically altered for reasons unrelated to ovulation.
Step-by-step: calibration for data quality (measurement consistency and chart integrity)
After timing calibration, focus on data quality calibration. This is about preventing avoidable errors and interpreting your results correctly.
Step 7: Use a consistent cycle start and tracking duration
Start tracking on day 1 of your cycle (the first day of full flow). Keep tracking daily through at least the first 7–10 days after you expect ovulation, or through the first day of your next cycle if you’re using BBT to confirm patterns.
Practical target: aim for 30–60 consecutive days of data over 2 cycles. That’s enough to see typical temperature behavior and identify how your body responds in different phases.
Step 8: Create a “data quality rating” for each reading
Don’t delete readings automatically. Instead, label them so you can interpret them responsibly.
Use a simple 3-tier system:
- High confidence: within 15 minutes of target wake time, normal sleep, no illness.
- Medium confidence: within 15–30 minutes or minor sleep disruption (like a brief wake under 20 minutes).
- Low confidence: beyond 30 minutes, short sleep (3 hours), or illness/fever.
In most tracking apps, you can add notes per day. If you’re using a paper log, include an extra column for confidence and your notes.
Step 9: Watch for device drift and replacement timing
Thermometers can drift. Don’t assume they stay perfect for years.
Set a maintenance rule. For example:
- Every 2–3 months, do a quick consistency check (3 back-to-back readings under the same conditions).
- If readings start varying more than before, replace the thermometer or troubleshoot.
Also, if you change batteries, re-check consistency soon after. If your thermometer uses a probe cover, replace it consistently and avoid using a different cover type without noting it.
Step 10: Handle outliers using your labeling rules, not impulse
When you see a temperature spike or drop, resist the urge to “fix” your data immediately. First, check your labels:
- Was sleep shorter?
- Was measurement late by more than 30 minutes?
- Was there illness, fever, or alcohol?
- Did you wake and stay up?
If the answer is yes, treat it as a lower-confidence point. If the answer is no, keep it and investigate other causes (like unusual room temperature or a change in routine).
Step 11: Confirm ovulation patterns with consistent post-ovulation behavior
BBT is typically used to confirm ovulation after it has occurred, not to predict it with certainty. Your focus should be on the pattern: a sustained rise rather than a single day.
As you review your chart, look for a shift that lasts several days. Your exact threshold depends on your baseline and your device resolution, but the principle stays the same: real ovulation-related shifts are usually sustained.
Practical approach: compare the days before the shift to the days after it. If your “after” readings are consistently higher and your “before” readings are consistently lower, that supports a true pattern.
Step 12: Make your chart review systematic (weekly and cycle-based)
Review at two times:
- Weekly: Check timing adherence. Ask, “How many readings were outside the ideal window?” If the answer is high, tighten sleep schedule or measurement setup.
- Cycle-based: After the cycle ends, look at confidence labels and identify recurring issues (for example, late wake-ups on weekends).
This prevents you from waiting months to realize the routine needs adjustment.
Common mistakes that damage basal body temperature fertility tracking data
Even with the right device, data quality can collapse due to predictable errors. Avoid these.
- Measuring after getting up: BBT is meant to be measured immediately after waking. If you walk around first, the reading won’t reflect basal conditions.
- Changing thermometer placement or route: Switching between oral and vaginal measurement, or changing technique, can create artificial shifts.
- Inconsistent wake times: If your wake time varies by 2–3 hours daily, your chart becomes hard to interpret. Timing calibration rules help, but consistency is still the foundation.
- Ignoring illness and fever: Fever can raise temperature and obscure the ovulation shift.
- Deleting “bad days” without documentation: Data deletion can hide patterns. Label and note instead, so you can interpret responsibly.
- Stopping tracking too early: If you stop before the post-ovulation rise is established, you lose the confirmation signal.
- Not recording sleep disruption: Even one night of fragmented sleep can create a misleading spike or dip.
- Assuming device changes don’t matter: A new thermometer, a different unit setting, or a changed battery can introduce drift.
Additional practical tips and optimisation advice
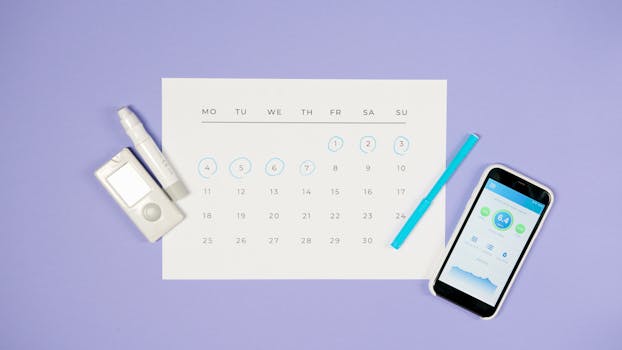
Once you’ve implemented the routine, you can improve reliability with targeted adjustments.
Optimise your environment to reduce temperature noise
Room temperature can influence readings, especially if your sleep environment changes. Keep your bedroom conditions as stable as possible. If you use a fan or heater, aim for consistent settings. In winter, for example, a sudden drop in room temperature might affect your baseline and make day-to-day comparisons noisier.
Use a “weekend strategy” when your schedule changes
A common real-world scenario: you wake at 6:30 a.m. on weekdays but sleep until 8:30 a.m. on weekends. That 2-hour shift is exactly the kind of timing drift that can distort your chart.
Instead of abandoning weekend data, use a weekend strategy:
- Set a secondary alarm for your usual weekday time (6:30–6:45 a.m.).
- If you wake, measure immediately and then decide whether to fall back asleep.
- Label any reading where you fell back asleep after measuring as “measured then slept again” so you remember the context.
This keeps your data aligned with your calibration window.
Practical example: calibrating after a late measurement pattern
Imagine you start tracking and notice that 4 out of 7 days are measured 45–60 minutes later than your target time. After 10 days, you feel uncertain about the chart.
Fix it with a calibration adjustment:
- For 2 weeks, reduce the wake-time variability by setting a consistent bedtime alarm or pre-sleep routine.
- Keep the thermometer at the same spot and place your phone alarm so you don’t reach for it.
- Apply your quality labels: treat late readings as medium/low confidence.
- After 14 days, reassess. If late readings drop below 1–2 per week, your data reliability will improve noticeably.
This is the point of calibration: you’re not just collecting data—you’re improving the conditions under which it’s collected.
Consider resolution and recording habits
Resolution matters. If your thermometer records only in coarse steps, subtle shifts may be harder to detect. If your thermometer supports finer increments (for example, 0.01°F or 0.01°C), it can make day-to-day patterns easier to see. Regardless of device resolution, the consistency of your measurement technique matters more than chasing tiny differences.
Also, make sure your recording method doesn’t introduce errors. If you manually enter temperatures, enter the number immediately after the beep, and double-check you’re using the correct unit.
Protect your routine against common disruptions
Plan for disruptions that are common in real life:
- Travel: Pack your thermometer and keep your measurement time as close as possible to your usual target. If time zones change, follow your calibration rule based on your local wake time rather than the previous location’s clock.
- Night shifts: If your sleep schedule changes drastically, BBT may become less meaningful without a new consistent wake-time routine. If you’re on rotating shifts, track with caution and focus on stable sleep blocks.
- Shared beds: If your partner’s schedule regularly wakes you, your BBT might reflect fragmented sleep. Label those days and consider adjusting your measurement setup to reduce wake-ups.
Don’t overreact to single-day fluctuations
BBT naturally fluctuates. One high or low reading rarely tells you much. Your job is to build a dataset where you can recognize patterns. That’s why labeling, timing calibration, and consistent measurement technique are more valuable than perfect readings on any one day.
Use your data to guide next steps, not self-blame
When your chart is messy, it usually means the routine needs adjustment, not that your body is unpredictable. If you see consistent timing drift, fix the wake-time setup. If you see repeated spikes, check sleep disruption and illness notes. If you see a clear post-ovulation rise, your routine is working—even if some individual days are imperfect.
Over time, a well-calibrated basal body temperature fertility tracking routine becomes a reliable window into your cycle physiology. The quality comes from your process, not from any single measurement.
21.02.2026. 11:17