Reduce False Conclusions: Wearable Data Causation vs Correlation
Why wearable insights can mislead

Wearable devices can be powerful tools for noticing patterns in sleep, recovery, activity, heart rate, and stress. But the same convenience that makes wearables useful also makes them easy to misuse. A common failure mode is jumping from “my metric changed” to “this caused it.” That leap is where false conclusions enter.
In biohacking and health optimization, the goal isn’t to ignore wearable data—it’s to interpret it correctly. The difference between causation and correlation is the foundation for making decisions that stand up to reality. When you understand how to test claims, control for confounders, and separate signal from noise, you reduce the odds of building your routines on accidental coincidences.
This myth-busting guide focuses on practical ways to reduce false conclusions from wearable data, without requiring complex statistics or a lab environment.
Correlation: what it can tell you—and what it cannot
Correlation is a pattern, not proof
Correlation means two variables move together. For example, you might notice that after taking magnesium, your resting heart rate drops—or that your sleep score improves on days you walk after dinner. These observations can be meaningful, but they do not establish that the intervention caused the change.
Wearables often capture downstream effects of many overlapping factors: stress, schedule changes, hydration, caloric intake, alcohol, caffeine timing, illness, travel, and even the day-to-day variability in how the device reads your physiology.
Why wearable data correlates so easily
Most wearable signals are influenced by multiple drivers. Resting heart rate can shift with temperature, sleep debt, training load, emotional stress, and caffeine. Sleep staging algorithms can change when your movement pattern or sensor contact changes. Even “steps” correlate with many other lifestyle habits at once.
When variables co-occur, correlation is likely—even if the relationship is indirect. The risk is treating correlation as causal evidence.
Causation: the standard you need before changing behavior
What “caused by” really means
Causation implies that the intervention (or exposure) is responsible for the outcome, not merely associated with it. In practice, causation requires ruling out alternative explanations. That usually means demonstrating that:
- The change in the outcome happens consistently after the intervention.
- The outcome would not be expected to change in the same way without the intervention.
- Other plausible drivers are controlled or accounted for.
- The effect is reproducible across time (and ideally across conditions).
Common causal traps in wearable interpretation
Even thoughtful people fall into predictable traps:
- Temporal confusion: “I took X and later my HRV improved” doesn’t mean X caused the improvement.
- Selection bias: You remember the days that fit your hypothesis more than the days that contradict it.
- Regression to the mean: Extreme values often move back toward average naturally, which can look like an effect.
- Confirmation bias: If you expect a supplement to work, you may interpret normal fluctuations as success.
- Overfitting your story: You adjust multiple variables at once and then attribute the outcome to the most interesting one.
These traps don’t mean wearables are useless. They mean you need a disciplined method for interpreting what you see.
Myth: “My wearable shows it, so it’s causation”
The myth is that device readings automatically translate into causal conclusions. Wearables measure associations in real time. They rarely provide the experimental structure needed for causation.
For example, if your sleep score improves after you stop eating late, that can be causal—but it can also be confounded by earlier bedtimes, reduced stress, less alcohol, or simply better consistency that week. Without a way to compare against a baseline and isolate variables, you cannot responsibly claim causation.
To reduce false conclusions, treat wearable observations as hypotheses. Then test them with a method that can challenge your assumption.
How to reduce false conclusions using better study design
Start with a clear, testable hypothesis
Instead of “magnesium improves recovery,” use something like: “On days I take magnesium at 8 pm, my next-morning resting heart rate will be lower than on days I do not take it, controlling for sleep duration and training load.” The more specific you are, the easier it is to evaluate whether your data actually supports the claim.
Use baseline periods before and after
Many false conclusions come from comparing a single “intervention day” to a random day before it. A better approach is to establish a baseline over multiple days. Then compare the intervention period to that baseline.
Even if you cannot run a formal trial, you can still use time structure:
- Baseline: Observe for 1–2 weeks while keeping routines stable.
- Intervention window: Introduce one change while holding other variables as constant as possible.
- Return to baseline: Stop the change and see whether the metric returns toward previous patterns.
This reduces the chance that you’re seeing a coincidental shift.
Change one variable at a time when possible
Wearables make it tempting to tweak multiple inputs—supplements, workouts, caffeine timing, meal timing, light exposure—because you can “see something” quickly. But if you change everything, you cannot identify what caused what.
For causation, isolation matters. If you must change multiple variables, be honest that you are testing a package, not a single causal factor.
Account for confounders you can measure
Not all confounders are visible, but many are. Practical examples include:
- Training load: Hard days naturally affect HRV, resting heart rate, and sleep.
- Sleep duration: Short sleep can reduce HRV and raise resting heart rate regardless of interventions.
- Caffeine and alcohol: Timing strongly affects sleep quality and autonomic signals.
- Illness and stress: Even minor sickness or emotional strain can dominate wearable patterns.
If you record these alongside your wearable metrics, you can interpret correlations with more caution and less narrative certainty.
Interpreting common wearable metrics without overclaiming
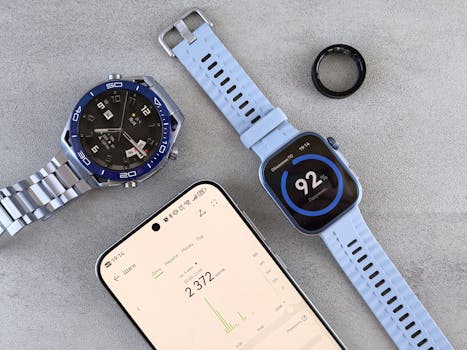
Resting heart rate and HRV
Resting heart rate and HRV are often used as “recovery” markers. They can be informative, but they are not specific. HRV reflects autonomic balance and is influenced by sleep, stress, training, hydration, and even measurement quality.
If resting heart rate drops after a behavior change, that’s a promising correlation. But causation requires checking whether the improvement is consistent after adjusting for sleep length, exercise intensity, and illness. Also remember that HRV can vary day to day; a single swing is rarely enough evidence.
Sleep staging and “sleep score”
Sleep stages are derived from algorithms that infer sleep from movement, heart rate, and other signals. Different devices may score sleep differently, and even the same device can vary based on sensor fit and skin contact.
If your sleep score improves after an intervention, it may be real. But it may also be an artifact of algorithmic changes, sensor contact, or simply more consistent wear. Confirm with multiple signals such as total sleep time, awakenings, and how you feel, rather than treating one composite number as causal proof.
Activity metrics and “readiness” scores
Steps, active minutes, and readiness scores correlate with many health behaviors. If your readiness improves on days you walk, the walk may help—or it may simply coincide with better schedules, more daylight exposure, and lower stress. The causal question remains: would readiness improve if you kept everything else the same and only changed the walk?
Practical testing approaches for individuals
Try structured A/B testing in real life
While true randomized controlled trials aren’t always feasible, you can mimic their logic. For example, if testing caffeine timing:
- Choose a consistent dose and timing window.
- Compare nights with caffeine before a cutoff versus nights without it, while keeping bedtime and training similar.
- Track outcomes for at least several days per condition to reduce noise.
This approach reduces the likelihood that random variation is mistaken for a causal effect.
Use “stop rules” to avoid chasing noise
False conclusions often grow because people keep experimenting until they find a pattern that flatters their hypothesis. A stop rule helps:
- If an intervention shows no consistent direction across multiple comparable days, stop testing it.
- If the effect appears only once or twice, treat it as a weak signal rather than evidence.
- If you need to keep changing multiple variables to make the result appear, the causal claim is likely overstated.
Be careful with short timelines
Many wearable metrics are influenced by weekly routines and natural variability. A three-day “experiment” can easily produce misleading correlation. Longer observation periods—especially when paired with stable routines—reduce the chance of attributing normal fluctuation to causation.
How to document findings so you don’t rewrite history
Keep a simple log tied to the hypothesis
Documentation is not bureaucracy; it’s a defense against cognitive bias. Record:
- What you changed (dose, timing, duration)
- When you changed it
- Baseline context (sleep duration, training intensity, alcohol/caffeine timing)
- The outcome metrics you’re evaluating
This makes it easier to see whether the effect is consistent or whether your memory is selecting favorable days.
Separate “I noticed” from “I concluded”
A useful mindset is to label your statements. “I noticed HRV increased after X” is a different claim than “X improved recovery.” The second claim requires stronger evidence. When you keep those categories distinct, you reduce false conclusions.
Relevant tools and data sources (and their limits)
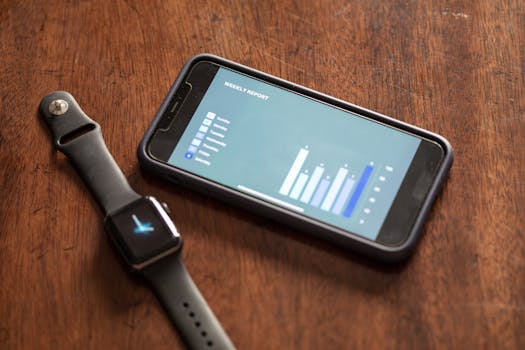
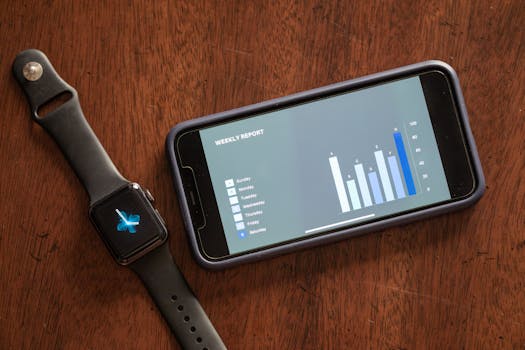
Many people use wearable ecosystems such as Garmin Connect, Apple Health, Oura, Whoop, Fitbit, or similar platforms to review trends. These apps can be valuable for finding correlations and visualizing patterns over time. They can also encourage overinterpretation because dashboards often emphasize “readiness” or “sleep score” without communicating uncertainty.
To reduce false conclusions, treat platform summaries as starting points. Look at raw or semi-raw components when available, and prioritize consistent, comparable measures over one-off highlights.
Prevention checklist: making wearable insights more causal
Use this checklist to reduce the odds that you’ll confuse correlation with causation:
- Define the outcome (e.g., next-morning resting heart rate, not “recovery” generally).
- Establish a baseline before making changes.
- Change one variable when possible, or clearly label what package you’re testing.
- Track confounders you can measure (sleep duration, training load, caffeine/alcohol timing).
- Look for consistency across multiple comparable days, not a single dramatic shift.
- Document context so you don’t rely on memory.
- Use stop rules to avoid chasing noise.
When you apply these steps, you don’t just reduce false conclusions—you also make your biohacking process more efficient. The most useful interventions are the ones that survive scrutiny over time.
Summary: causation is earned, not assumed
Wearable data can reveal meaningful patterns, but patterns are not proof of cause. Correlation can be a signal worth investigating, yet it is not enough to responsibly claim causation—especially when multiple lifestyle factors change at once or when measurement noise is involved.
To reduce false conclusions, treat your wearable metrics as hypotheses. Use baseline periods, isolate variables, track confounders, and require consistency before changing your routines. With that discipline, wearable insights become less about storytelling and more about evidence-based iteration.
03.04.2026. 05:05