

LC3 p62 Autophagy Marker Interpretation: FAQ Guide

When you run autophagy assays, the readout often comes down to two proteins: LC3 and p62/SQSTM1. But “more” or “less” can be misleading unless you interpret the pattern correctly and, ideally, include autophagy flux controls. This FAQ hub walks you through the LC3 p62 autophagy marker interpretation most labs use, what each pattern usually means, and how to avoid the most common errors.
What do LC3 and p62 measure in autophagy?
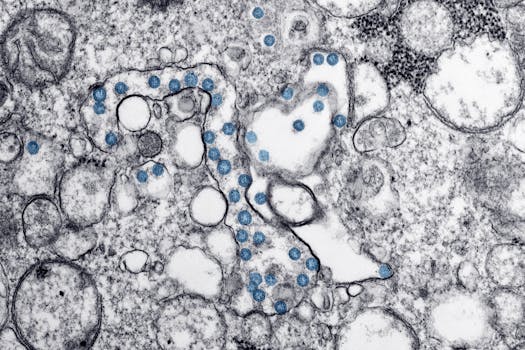
LC3 and p62 are linked to the autophagy pathway, but they reflect different steps.
LC3 is processed from LC3-I to LC3-II when autophagosomes form. LC3-II is associated with autophagosome membranes, so it tends to increase when autophagosome formation is higher or when degradation is blocked.
p62/SQSTM1 is a cargo adaptor that binds ubiquitinated proteins and helps deliver them to autophagosomes. If autophagy is functioning and p62 is being degraded, p62 levels typically decrease. If autophagy is impaired at the degradation step, p62 often accumulates.
In practice, you interpret them together to infer whether autophagy is being induced, blocked, or whether the system is simply accumulating autophagosomes.
How should you interpret LC3-II increase without flux controls?
An increase in LC3-II on a Western blot can mean either:
- Autophagy induction is increased (more autophagosomes are being formed).
- Autophagy flux is blocked (autophagosomes are formed but not degraded, so LC3-II accumulates).
Without flux controls, you cannot confidently distinguish these scenarios. A common approach is to treat parallel samples with a lysosomal inhibitor (commonly bafilomycin A1 or chloroquine) for a short window (often 2–4 hours, depending on your model) before lysis. If LC3-II rises further with the inhibitor, it suggests ongoing flux and induction. If LC3-II does not increase with inhibitor, it may indicate a blockade upstream or already-maximal accumulation.
What does decreased p62 usually indicate?

A decrease in p62 usually suggests that cargo delivery to autophagosomes and subsequent degradation in lysosomes are functioning. In many cell types, p62 drops after autophagy induction such as:
- Starvation (commonly 2–24 hours depending on conditions)
- mTOR inhibition (often within 6–24 hours depending on dose and cell line)
However, p62 can also be regulated at the transcriptional level. If p62 decreases but LC3-II does not increase (or increases only weakly), you may need to check whether p62 is being transcriptionally suppressed rather than degraded. Measuring both protein levels and autophagic flux helps you avoid this ambiguity.
What does p62 accumulation with increased LC3-II suggest?
When you see LC3-II increase and p62 accumulation at the same time, the pattern often points to a defect in autophagic degradation—meaning autophagosomes are present, but they are not being cleared efficiently.
Examples of situations that can produce this pattern include:
- Lysosomal dysfunction or impaired acidification
- Blockade of autophagosome-lysosome fusion
- Inhibitors acting late in the pathway
To confirm, you would typically add a flux inhibitor in parallel. The goal is to test whether the system can still increase LC3-II further when degradation is blocked, and whether p62 continues to accumulate.
How do you interpret LC3 puncta in immunofluorescence?
LC3 puncta (often visualized as LC3-positive dots) reflect autophagosome-related structures. But puncta alone can be ambiguous, similar to LC3-II on a blot.
In general:
- More puncta can mean increased autophagosome formation.
- More puncta that persist after lysosomal blockade can indicate reduced clearance and impaired flux.
A practical approach is to quantify puncta with and without a lysosomal inhibitor. If puncta substantially increase after inhibitor treatment, that usually supports active flux. If puncta are already high and do not increase further with inhibitor, it may indicate a degradation block or maximal accumulation.
What autophagy flux controls are commonly used?

Flux controls help you distinguish “more autophagosomes” from “autophagosomes are not being cleared.” Common strategies include:
- Lysosomal inhibitors: bafilomycin A1 or chloroquine, typically added for a short window (often 2–4 hours) prior to harvest.
- Time-course sampling: collect samples at multiple time points (for example, 0, 6, 12, and 24 hours) after induction or treatment.
- Genetic or pharmacologic pathway perturbations: use established tools to validate pathway position (for example, upstream regulators of initiation vs. late-stage inhibitors).
For interpretation, the key readout is whether LC3-II and/or puncta increase further when lysosomal degradation is blocked. That “extra” increase suggests ongoing flux.
Why can p62 interpretation be tricky in some experiments?
p62 is not just a passive marker of degradation. It is also influenced by:
- Transcriptional regulation (for example, pathways that activate stress responses)
- Protein synthesis changes under stress
- Ubiquitination status and cargo availability
So p62 can increase even if degradation is partially working, or decrease due to reduced synthesis rather than enhanced autophagic clearance. If your treatment strongly changes global stress signaling, it’s especially important to pair p62 with LC3 patterns and flux controls.
A useful practical step is to measure p62 at multiple time points. If p62 drops quickly (within a few hours) alongside flux evidence, degradation is more likely. If p62 changes slowly and tracks with transcriptional markers, synthesis regulation may be dominating.
How do you interpret LC3-II when total LC3 levels change?
LC3-II is the processed, membrane-associated form. When you interpret LC3-II, you should consider whether total LC3 expression is shifting. If your treatment changes total LC3 protein, apparent LC3-II changes could partly reflect altered expression rather than pathway activity.
To interpret accurately:
- Use antibodies that clearly resolve LC3-I vs LC3-II.
- Normalize LC3-II to a loading control (commonly total protein or housekeeping protein), and consider reporting both LC3-I and LC3-II.
- Include flux conditions so you can test whether LC3-II accumulation is due to blocked degradation rather than increased expression.
In many labs, the most informative readout is how LC3-II changes with lysosomal blockade, not LC3-II alone.
What time window is typical for LC3 and p62 changes after induction?

Time matters because LC3 and p62 respond on different timelines.
Commonly used windows include:
- LC3-II: often detectable changes within 2–6 hours after autophagy induction, with more robust shifts by 12–24 hours depending on the stimulus and cell type.
- p62: can decrease over 6–24 hours when degradation is active, but the kinetics can vary widely.
A practical example: if you starve cultured cells for 4 hours and see a modest LC3-II rise but no p62 change yet, that can still be consistent with early induction. If you extend to 16–24 hours and p62 drops while flux is supported (for example, LC3-II increases further with inhibitor), you strengthen the conclusion that autophagy is active.
How do you interpret results when LC3 decreases but p62 increases?
This pattern can happen and usually suggests a complex situation. A decrease in LC3-II can reflect reduced autophagosome formation, while p62 accumulation indicates impaired degradation of cargo.
Possible explanations include:
- Reduced initiation (less autophagosome formation) alongside incomplete clearance of existing autophagosomes.
- Assay timing mismatch: you may be sampling during a transition period where LC3 signals fall faster than p62.
- Pathway interference affecting cargo processing or ubiquitin signaling, not only autophagy initiation.
To resolve it, you would typically run a time course and include a flux inhibitor. If LC3-II still increases with inhibitor despite lower baseline LC3-II, it suggests that degradation machinery is still engaged but initiation is altered. If LC3-II does not increase with inhibitor, degradation may already be severely blocked.
What should you check if LC3 and p62 results don’t match expectations?
When LC3 and p62 do not follow the pattern you expect, it’s usually due to technical issues, timing, or pathway complexity. Check:
- Antibody specificity and band resolution: LC3-I and LC3-II must be distinguishable. p62 antibody performance also matters.
- Loading and normalization: use consistent loading controls and consider total protein normalization.
- Cell health and viability: severe stress or cell death can distort autophagy readouts.
- Treatment duration: sample at multiple time points rather than one.
- Flux adequacy: confirm that your inhibitor conditions truly block lysosomal degradation in your system.
For a real-world scenario, imagine you treat cells with an autophagy inducer for 6 hours. LC3-II increases, but p62 stays unchanged. If you only run one time point, you might conclude “no autophagy.” Instead, extend to 16 hours and add a lysosomal inhibitor on parallel plates. Often you’ll see p62 decrease later and LC3-II accumulate further with inhibitor, supporting active flux.
How do you interpret autophagy marker data in tissues versus cultured cells?

In tissues, interpretation is more challenging because cell populations, baseline metabolism, and diffusion of drugs can vary. Still, the principles are the same: LC3-II and p62 patterns are informative only when you consider flux and context.
Common considerations include:
- Cell-type heterogeneity: different cells can have different autophagy activity.
- Sampling and processing time: autophagy-related proteins can change with handling time.
- Inhibitor feasibility: in vivo flux measurements are harder; you may rely on ex vivo approaches or surrogate readouts.
If you interpret tissue lysates, you should aim for careful controls and, when possible, complementary methods such as immunostaining for LC3 puncta or measuring additional markers involved in lysosomal function.
What are common pitfalls in LC3 p62 autophagy marker interpretation?
Several pitfalls repeatedly lead to incorrect conclusions:
- Using LC3-II alone to claim increased autophagy without flux evidence.
- Assuming p62 always decreases: p62 can rise due to transcriptional stress or reduced cargo processing.
- Single time-point conclusions: autophagy is dynamic; a snapshot can be misleading.
- Over-inhibiting lysosomes: too long with inhibitors can create secondary stress responses and complicate interpretation.
- Not verifying inhibitor effectiveness: the inhibitor may not fully block degradation in your specific cell type or conditions.
To reduce these errors, plan for at least one flux condition and a short time course. Many labs also include a lysosomal function readout to ensure the late pathway is actually affected.
How do you report LC3 and p62 results for clear interpretation?
Clear reporting makes your interpretation more trustworthy. A strong reporting approach includes:
- State whether data reflect baseline or flux conditions (for example, with lysosomal inhibitor).
- Report time points and treatment concentrations when relevant.
- Provide densitometry or quantification method, including normalization strategy.
- Clarify whether you quantified LC3 puncta, LC3-II bands, or both.
- Include at least one loading control (or total protein normalization) and describe how you handled replicate variability.
If you’re comparing across experiments, keep exposure settings consistent for immunoblots and use multiple biological replicates. This is especially important because LC3-II can vary with gel percentage and transfer efficiency.
What practical workflow can you follow to interpret LC3 and p62 in your own study?
A practical, commonly used workflow looks like this:
- Choose your induction or treatment (for example, nutrient starvation or an mTOR pathway inhibitor).
- Collect a time course (for example, 0, 6, 12, and 24 hours).
- Run flux conditions in parallel: treat matched samples with a lysosomal inhibitor shortly before harvest (often 2–4 hours).
- Measure LC3 and p62 using Western blot and, if possible, immunofluorescence for puncta quantification.
- Interpret together:
- LC3-II increases with inhibitor and p62 decreases over time: supports active autophagic flux.
- LC3-II increases with inhibitor but p62 accumulates: supports impaired degradation.
- LC3-II decreases and p62 increases: suggests reduced formation plus degradation stress, requiring careful timing/flux checks.
In real lab terms, this reduces guesswork. You’re no longer asking “did LC3 change?” You’re asking whether the pathway is moving cargo through to lysosomal degradation.
When should you consider adding extra markers beyond LC3 and p62?
LC3 and p62 are powerful, but sometimes you need additional context. Consider adding other markers when:
- Your treatment affects lysosomes directly (for example, lysosomal pH or trafficking changes).
- You see inconsistent LC3 and p62 patterns and need to pinpoint where the block occurs.
- Your system has high baseline stress or rapid transcriptional changes that complicate p62 interpretation.
- You need to distinguish macroautophagy from related processes (like selective autophagy pathways).
Additional readouts can include lysosomal markers, autophagosome-lysosome fusion indicators, or cargo-specific adaptors depending on your biological question. Even when you add markers, keep the flux logic central.
Summary: how to interpret LC3 p62 autophagy marker patterns
For LC3 p62 autophagy marker interpretation, the most reliable conclusions come from interpreting LC3-II or LC3 puncta together with p62, and validating whether autophagic flux is active using lysosomal inhibition and/or time-course sampling. LC3 changes alone can reflect either induction or blockage. p62 typically decreases when degradation is functioning, but it can also be influenced by stress-driven transcription and timing. If you plan for flux controls and interpret patterns in context, your autophagy readouts become far more actionable and reproducible.
10.05.2026. 23:17