Homeostasis vs Allostasis: Wearable Trends in HRV
Wearables, HRV, and the real biology behind stress

Heart rate variability (HRV) has become one of the most discussed metrics in wearable health. Many apps now present HRV as a simple “stress” or “recovery” score, and users often interpret changes as proof that their body is failing or succeeding at coping. That interpretation can be misleading because it assumes a single framework for how physiology responds to demands.
To understand what HRV wearables are actually measuring—and what they can’t—it's helpful to distinguish two related concepts: homeostasis and allostasis. Homeostasis describes stable internal regulation. Allostasis describes adaptive regulation that shifts settings to meet changing needs. HRV sits at the intersection of these ideas because it reflects how autonomic control and physiological systems coordinate under both steady and changing conditions.
This article is a myth-busting guide for readers of Systems Biology Basics: it clarifies what homeostasis vs allostasis means in practice, explains common misconceptions about HRV trends, and offers practical guidance for interpreting wearable data more responsibly.
Homeostasis vs allostasis: what the terms mean in physiology
Homeostasis: keeping the “internal environment” stable
Homeostasis is the classic idea that the body works to maintain relatively constant internal conditions. Examples include temperature regulation and glucose balance. In this view, control systems aim to return variables toward a set point after a disturbance. When conditions change, feedback mechanisms act to reduce error and restore equilibrium.
In autonomic physiology, homeostatic thinking often maps to the idea that the body can maintain stable heart rhythm patterns by adjusting parasympathetic and sympathetic influences. If the body is healthy and the environment is stable, HRV patterns may also appear relatively consistent over time.
Allostasis: adapting control as demands shift
Allostasis reframes regulation as anticipatory and adaptive. Instead of returning quickly to one fixed set point, the body may shift its operating mode to meet new demands—sleep loss, training load, illness, emotional stress, travel, or environmental changes. The “stability” is not necessarily a single constant value; it’s stability of function despite changing conditions.
Allostasis is often described with the idea of a “cost” if adaptive responses are overused or poorly recovered. In HRV terms, this can look like patterns that change appropriately with demand: HRV may decrease during certain stressors and increase when recovery processes resume. The key point is that change itself can be adaptive, not automatically pathological.
Why the distinction matters for HRV interpretation
Many HRV narratives implicitly assume homeostasis: HRV should stay high, and deviations mean something is wrong. Allostasis introduces a different expectation: HRV will reflect dynamic control strategies. A drop in HRV during a workout week, a period of intense cognitive load, or an intercurrent infection could represent an adaptive shift in regulation—or it could indicate impaired recovery. Biology requires context.
Wearables can help detect trends, but they don’t automatically know which context applies. That’s why the homeostasis vs allostasis framing is more than academic—it shapes how you interpret HRV changes.
Myth: HRV wearables measure “stress” directly

HRV is a proxy for regulatory dynamics, not a stress meter
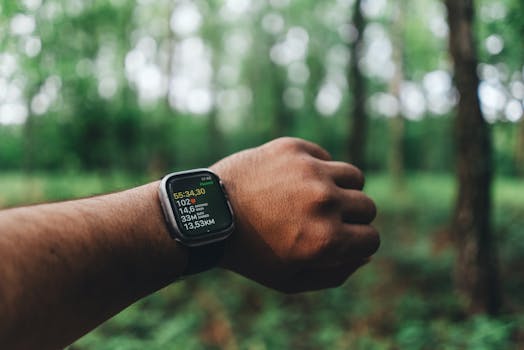
HRV refers to the variation in time intervals between heartbeats, typically derived from beat-to-beat signals. Many wearables estimate HRV using photoplethysmography (PPG) from the wrist or chest sensors, then compute metrics such as RMSSD (often used as a marker related to parasympathetic activity) or other time/frequency domain measures.
These metrics correlate with autonomic modulation, but HRV does not equal “stress.” Stress is a broad construct: it includes physiological, psychological, and environmental components. HRV reflects downstream physiological regulation—how quickly and flexibly the body can adjust—rather than a single direct label.
Allostasis explains why HRV can change for different reasons
During demanding situations, the body may increase sympathetic activity and reduce parasympathetic influence, often associated with lower HRV. But demand can be positive (exercise adaptation, challenge) or negative (illness, overreaching, sleep disruption). In an allostatic framework, both can involve altered autonomic control.
Therefore, the same HRV pattern can correspond to different biological states. The wearable’s algorithm may label both as “stress,” but the underlying physiology differs.
Practical guidance: interpret HRV alongside what changed
- Track situational context: training intensity, sleep duration, alcohol intake, travel, caffeine timing, and illness symptoms.
- Look for patterns, not single-day labels: HRV is noisy, and daily estimates can fluctuate due to sensor quality and normal variability.
- Use HRV trends to ask questions: “Is recovery trending better?” rather than “Am I stressed right now?”
Myth: higher HRV always means better health
“More variability” is not automatically “more resilience”
It’s tempting to treat higher HRV as a universal marker of wellness. In reality, HRV reflects system dynamics under specific conditions. For example, HRV can be influenced by age, fitness, circadian rhythm, baseline autonomic tone, medications, and breathing patterns.
In some contexts, very high HRV could be consistent with healthy parasympathetic tone. In other contexts, changes might reflect altered measurement conditions, irregular sleep timing, or changes in routine.
Allostasis adds another layer: the body may shift regulatory strategies to meet new demands. A “lower-than-usual” HRV could be appropriate if your body is adapting. Conversely, a “higher” HRV could occur during recovery but still coexist with other issues.
HRV must be interpreted as a system output
Systems biology emphasizes that physiology is integrated. HRV is one output of interacting systems: cardiovascular control, autonomic regulation, respiratory rhythm coupling, endocrine signals, and inflammatory status. A single metric can’t capture all of these. This is why HRV should be treated as a clue, not a verdict.
Practical guidance: compare to your own baseline
- Establish a personal baseline over weeks, not days.
- Use consistency as a signal: if HRV reliably drops for several days during a known stressor and rebounds after recovery, that may indicate functional adaptation.
- Be cautious with “extreme” interpretations: outlier days often reflect measurement or lifestyle changes rather than a stable biological conclusion.
Myth: HRV wearables can detect overtraining or illness with certainty
Algorithms can flag risk, but they can’t diagnose biology
Many wearable ecosystems now include “readiness,” “recovery,” or “stress balance” scores derived from HRV, resting heart rate, sleep staging proxies, and sometimes additional signals. These tools can be useful for trend awareness. However, they are not medical diagnostics.
Homeostasis vs allostasis helps explain why certainty is difficult. The body’s control systems adapt to changing demands. HRV changes can reflect normal allostatic shifts (e.g., training stress) or early illness. Without symptom data, temperature changes, inflammatory markers, and clinical context, a wearable can only estimate probability.
Why HRV signals overlap across different conditions
Reduced HRV can be associated with:
- Sleep disruption and circadian misalignment
- Acute psychological stress
- Heavy training loads and insufficient recovery
- Dehydration and changes in autonomic tone
- Infections and inflammatory responses
- Medication effects (including beta-blockers and others)
Because these share overlapping physiological pathways, HRV alone cannot separate causes reliably. The most responsible interpretation uses HRV as one input within a broader assessment.
Practical guidance: use HRV as a trigger for observation, not alarm
- Pair HRV with symptoms: persistent fatigue, sore throat, fever, unusual shortness of breath, or GI upset.
- Check recovery behaviors: are you sleeping enough, eating adequately, and spacing hard sessions?
- Adjust training conservatively when patterns persist: if HRV and resting heart rate trend unfavorably across multiple days, consider reducing intensity and prioritizing sleep.
If symptoms suggest illness or if HRV changes are dramatic and persistent, clinical evaluation is appropriate.
How homeostasis and allostasis show up in HRV patterns
Homeostatic signatures: recovery toward stability
In a homeostatic pattern, after a disturbance, the system returns toward a prior equilibrium. In HRV terms, you might see:
- HRV decreases during a predictable stress (e.g., a hard day)
- HRV rebounds after rest
- Resting heart rate normalizes
- Sleep quality proxies improve
This doesn’t mean the body is “unchanged”; it means regulation is restoring functional balance.
Allostatic signatures: shifting set points and operating modes
Allostasis can produce patterns where HRV changes remain altered for longer periods because the body is operating in a new mode. For example:
- During a multi-week training block, HRV may stay lower than baseline while adaptation occurs
- During a travel week, HRV may reflect circadian and routine disruption even without overtraining
- Under chronic stress, HRV may show persistent differences that correlate with sustained demands
The allostatic lens encourages you to ask: is the change temporary and followed by recovery, or is it persistent without adequate recovery?
A key prevention insight: “cost” accumulates when recovery lags
Allostasis introduces the idea of cumulative load. HRV can help you detect when the body is spending more effort to maintain function. The prevention guidance is therefore not “keep HRV high,” but rather “ensure recovery keeps pace with demands.”
Wearable HRV trends: what to trust and what to question
Measurement constraints: why HRV data can be inconsistent
Wearable HRV estimates depend on signal quality. Wrist PPG can be affected by motion artifacts, poor circulation, tattoos, skin contact, and sensor placement. Even high-quality devices can produce day-to-day variability.
Also, HRV metrics differ. Some apps emphasize RMSSD, others compute frequency-domain measures, and others use proprietary indices. Two devices may report different values for the same physiology. That’s not necessarily “wrong,” but it means you should be consistent with the same platform when evaluating trends.
Practical guidance: improve data quality before drawing conclusions
- Use consistent measurement conditions: same device, similar placement, and stable routines.
- Prefer resting measurements: many HRV metrics are more interpretable when captured during quiet periods.
- Mind breathing and posture: breathing rate and depth can influence HRV; sitting quietly or lying down can standardize conditions.
- Account for sleep timing: HRV varies across circadian phases.
Relevant wearable ecosystems and how they frame HRV
Popular wearable platforms such as Apple Watch (including HRV-based metrics like “Respiratory Rate” and “Heart Rate Variability” trends), Garmin devices (HRV and training readiness concepts), Oura ring (sleep and recovery-oriented HRV summaries), and WHOOP (strain and recovery reporting that includes HRV-related signals) illustrate a common trend: HRV is used to infer recovery status.
The educational takeaway is not which platform is best, but how these systems translate physiology into simplified indicators. The homeostasis vs allostasis framing helps you interpret them as dynamic indicators rather than absolute truths.
Myth-busting the “perfect day” narrative in HRV apps
Myth: a single HRV score reflects overall health
Many dashboards encourage a simplified storyline: “today’s readiness is high/low.” This can be helpful for awareness, but it can also distort interpretation. HRV is sensitive to many influences that are not captured in the app: hydration status, stressors not logged, menstrual cycle phase, medication timing, and subtle illness.
Allostasis explains why day-to-day HRV can be non-linear
Allostatic regulation is not a straight line. You might experience a day with lower HRV that still supports adaptation, followed by a day with higher HRV that reflects recovery and parasympathetic re-engagement. The body’s control systems are reacting to a moving target.
Practical guidance: interpret HRV as part of a multi-signal picture
- Combine HRV with resting heart rate: divergence patterns can be informative.
- Use sleep timing and duration: HRV changes often track sleep quality and circadian alignment.
- Consider training load: correlate HRV with session intensity and volume rather than only with “workout yes/no.”
- Note recovery behaviors: nutrition, hydration, stress management, and rest days.
Prevention guidance: using HRV trends without overreacting
Build a decision process grounded in allostasis
Instead of treating HRV as a pass/fail grade, use it to guide adjustments based on trends. A reasonable approach is:
- Observe multi-day patterns (baseline vs sustained shift).
- Check whether demands increased (training, stress, sleep disruption).
- Assess whether recovery followed (HRV rebound, stable resting heart rate, improved sleep).
- If unfavorable trends persist, reduce load and prioritize recovery behaviors.
When to seek medical input
Wearables can be informative, but HRV changes should not replace clinical evaluation. Consider professional guidance if you have concerning symptoms (chest pain, fainting, persistent shortness of breath) or if you suspect a significant illness. If HRV trends are persistently abnormal along with measurable health changes, it’s better to treat the situation as medical rather than purely training-related.
What to avoid
- Overinterpreting a single low HRV day: sensor noise and normal variability are common.
- Assuming “low HRV = danger”: allostasis can temporarily shift autonomic balance.
- Ignoring other signals: resting heart rate, sleep patterns, and real-world symptoms matter.
Summary: homeostasis vs allostasis is the missing key for HRV wearable literacy
The central myth in HRV wearable interpretation is that there is one correct direction a biomarker “should” move. Homeostasis thinking leads to rigid expectations: HRV should be high and stable. Allostasis thinking replaces that rigidity with adaptive context: HRV changes can be functional when demands change, and concerning when recovery does not keep pace.
Use the homeostasis vs allostasis lens to interpret HRV as a system output reflecting autonomic regulation under changing conditions. Trust trends more than single scores, improve measurement consistency, and pair HRV with sleep, resting heart rate, training load, and symptoms. When you do, HRV becomes less of an alarm and more of a useful window into how your physiology adapts.
07.05.2026. 06:19